 Mobarok Hossain
 April 25, 2024
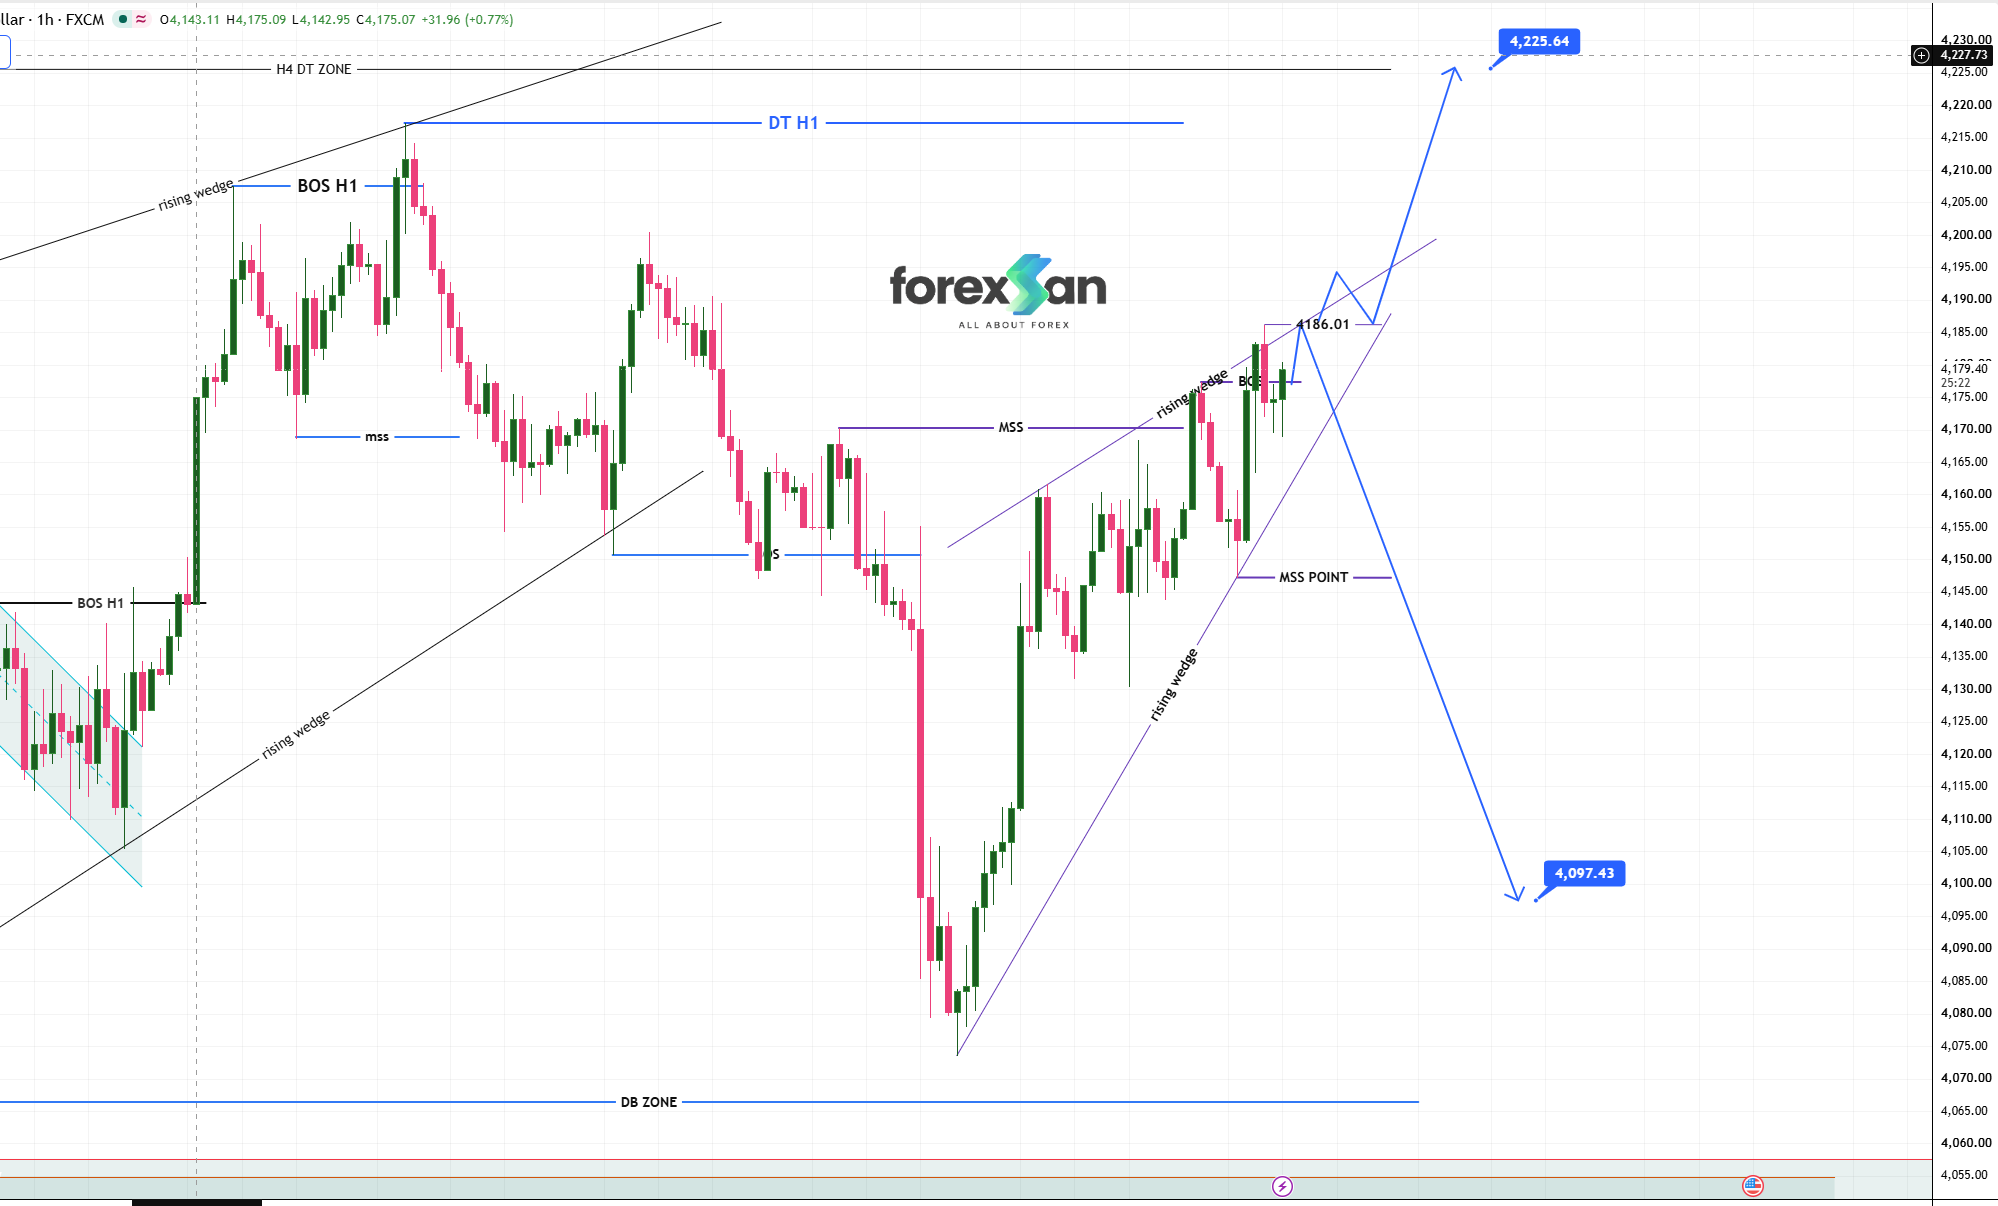
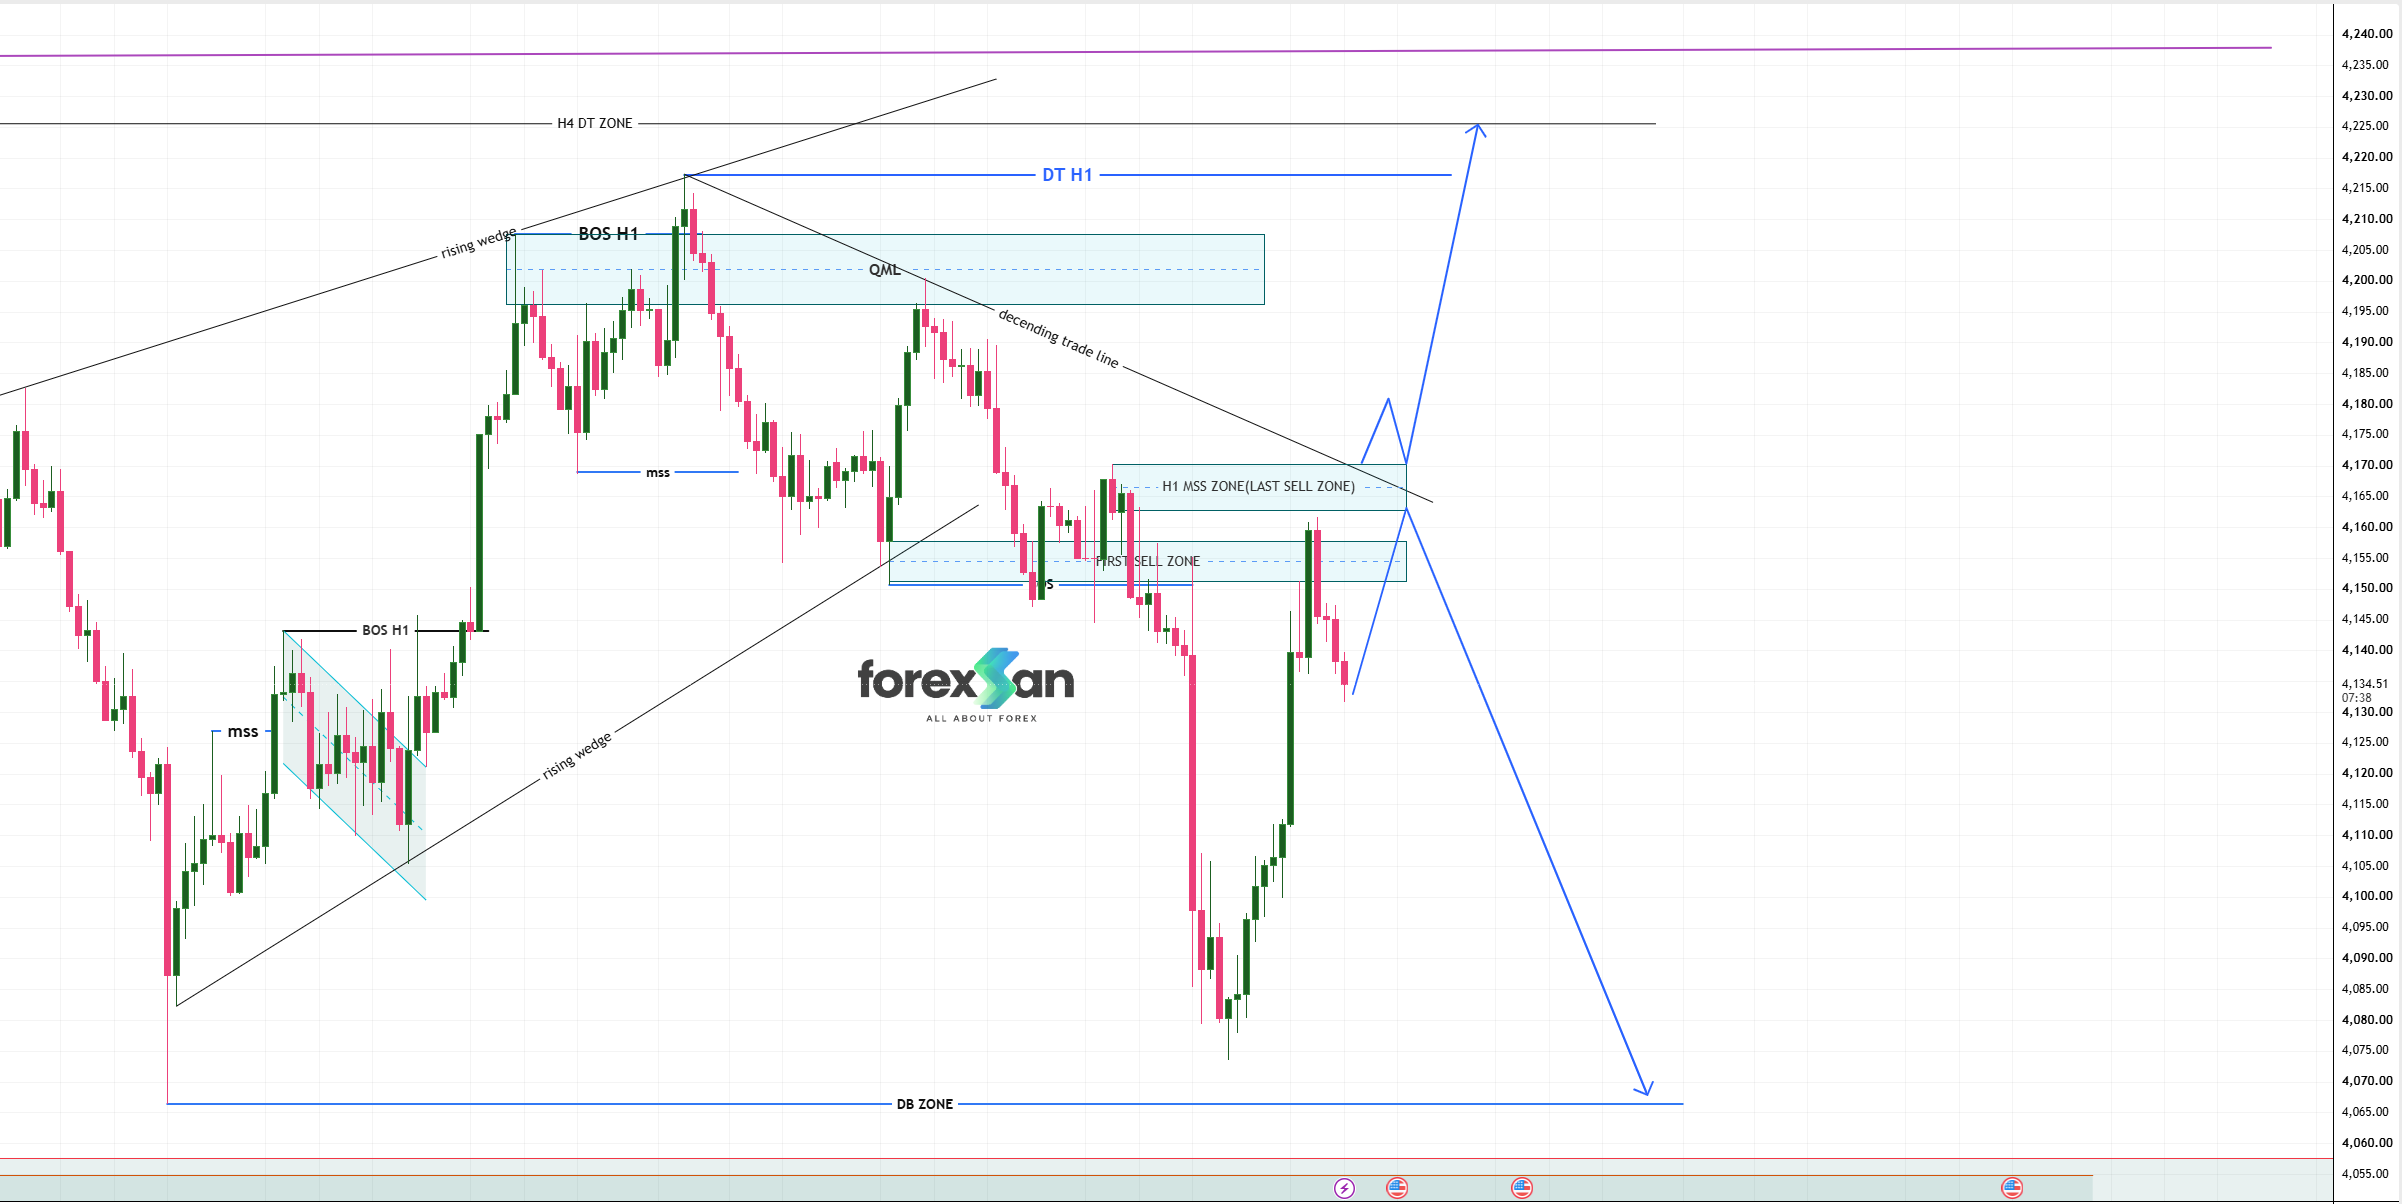
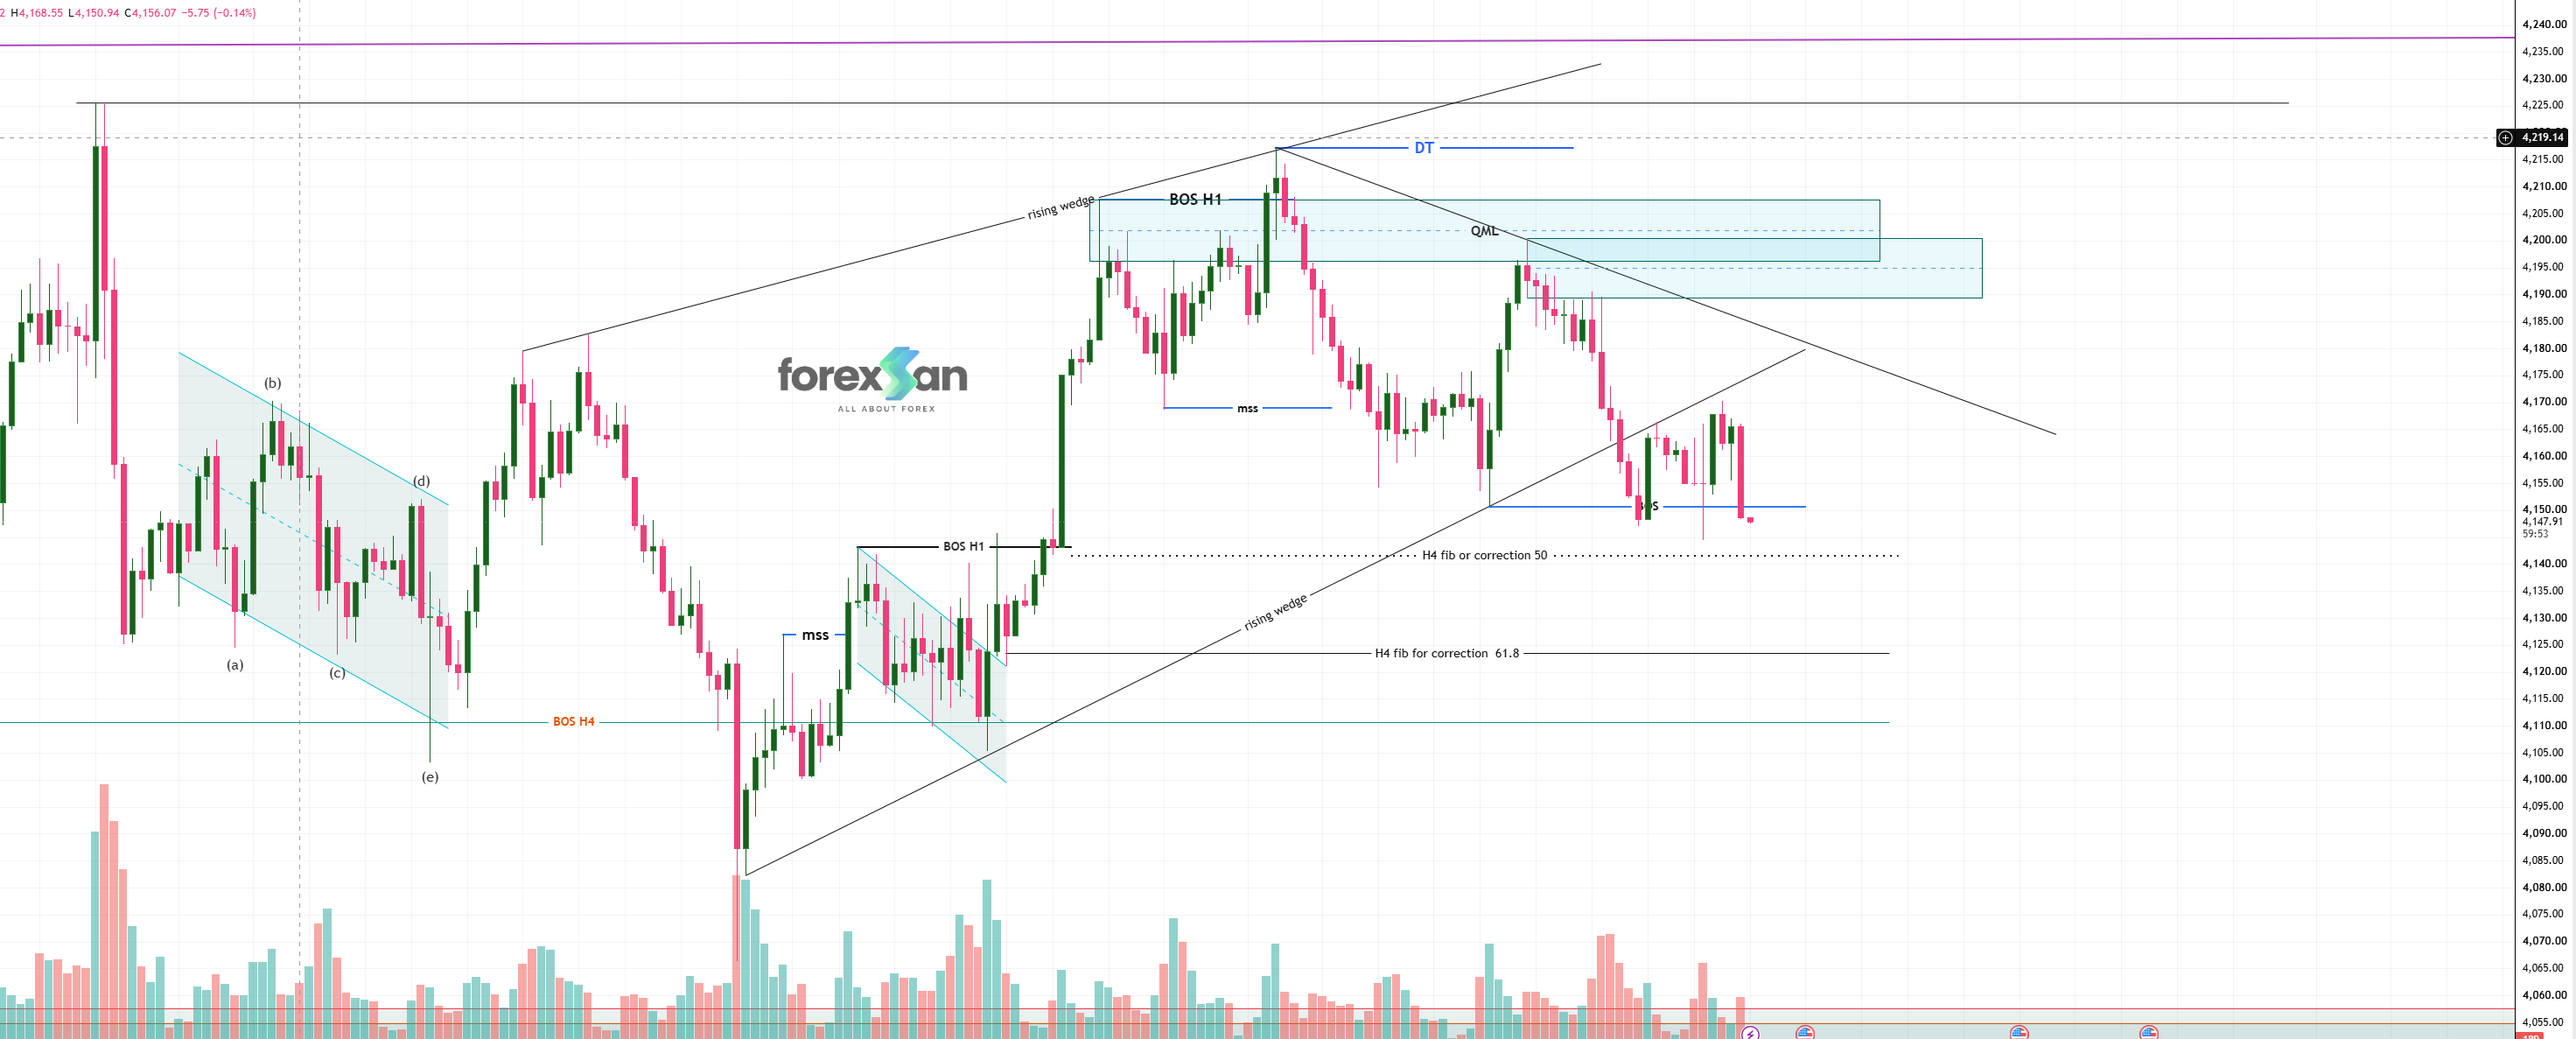
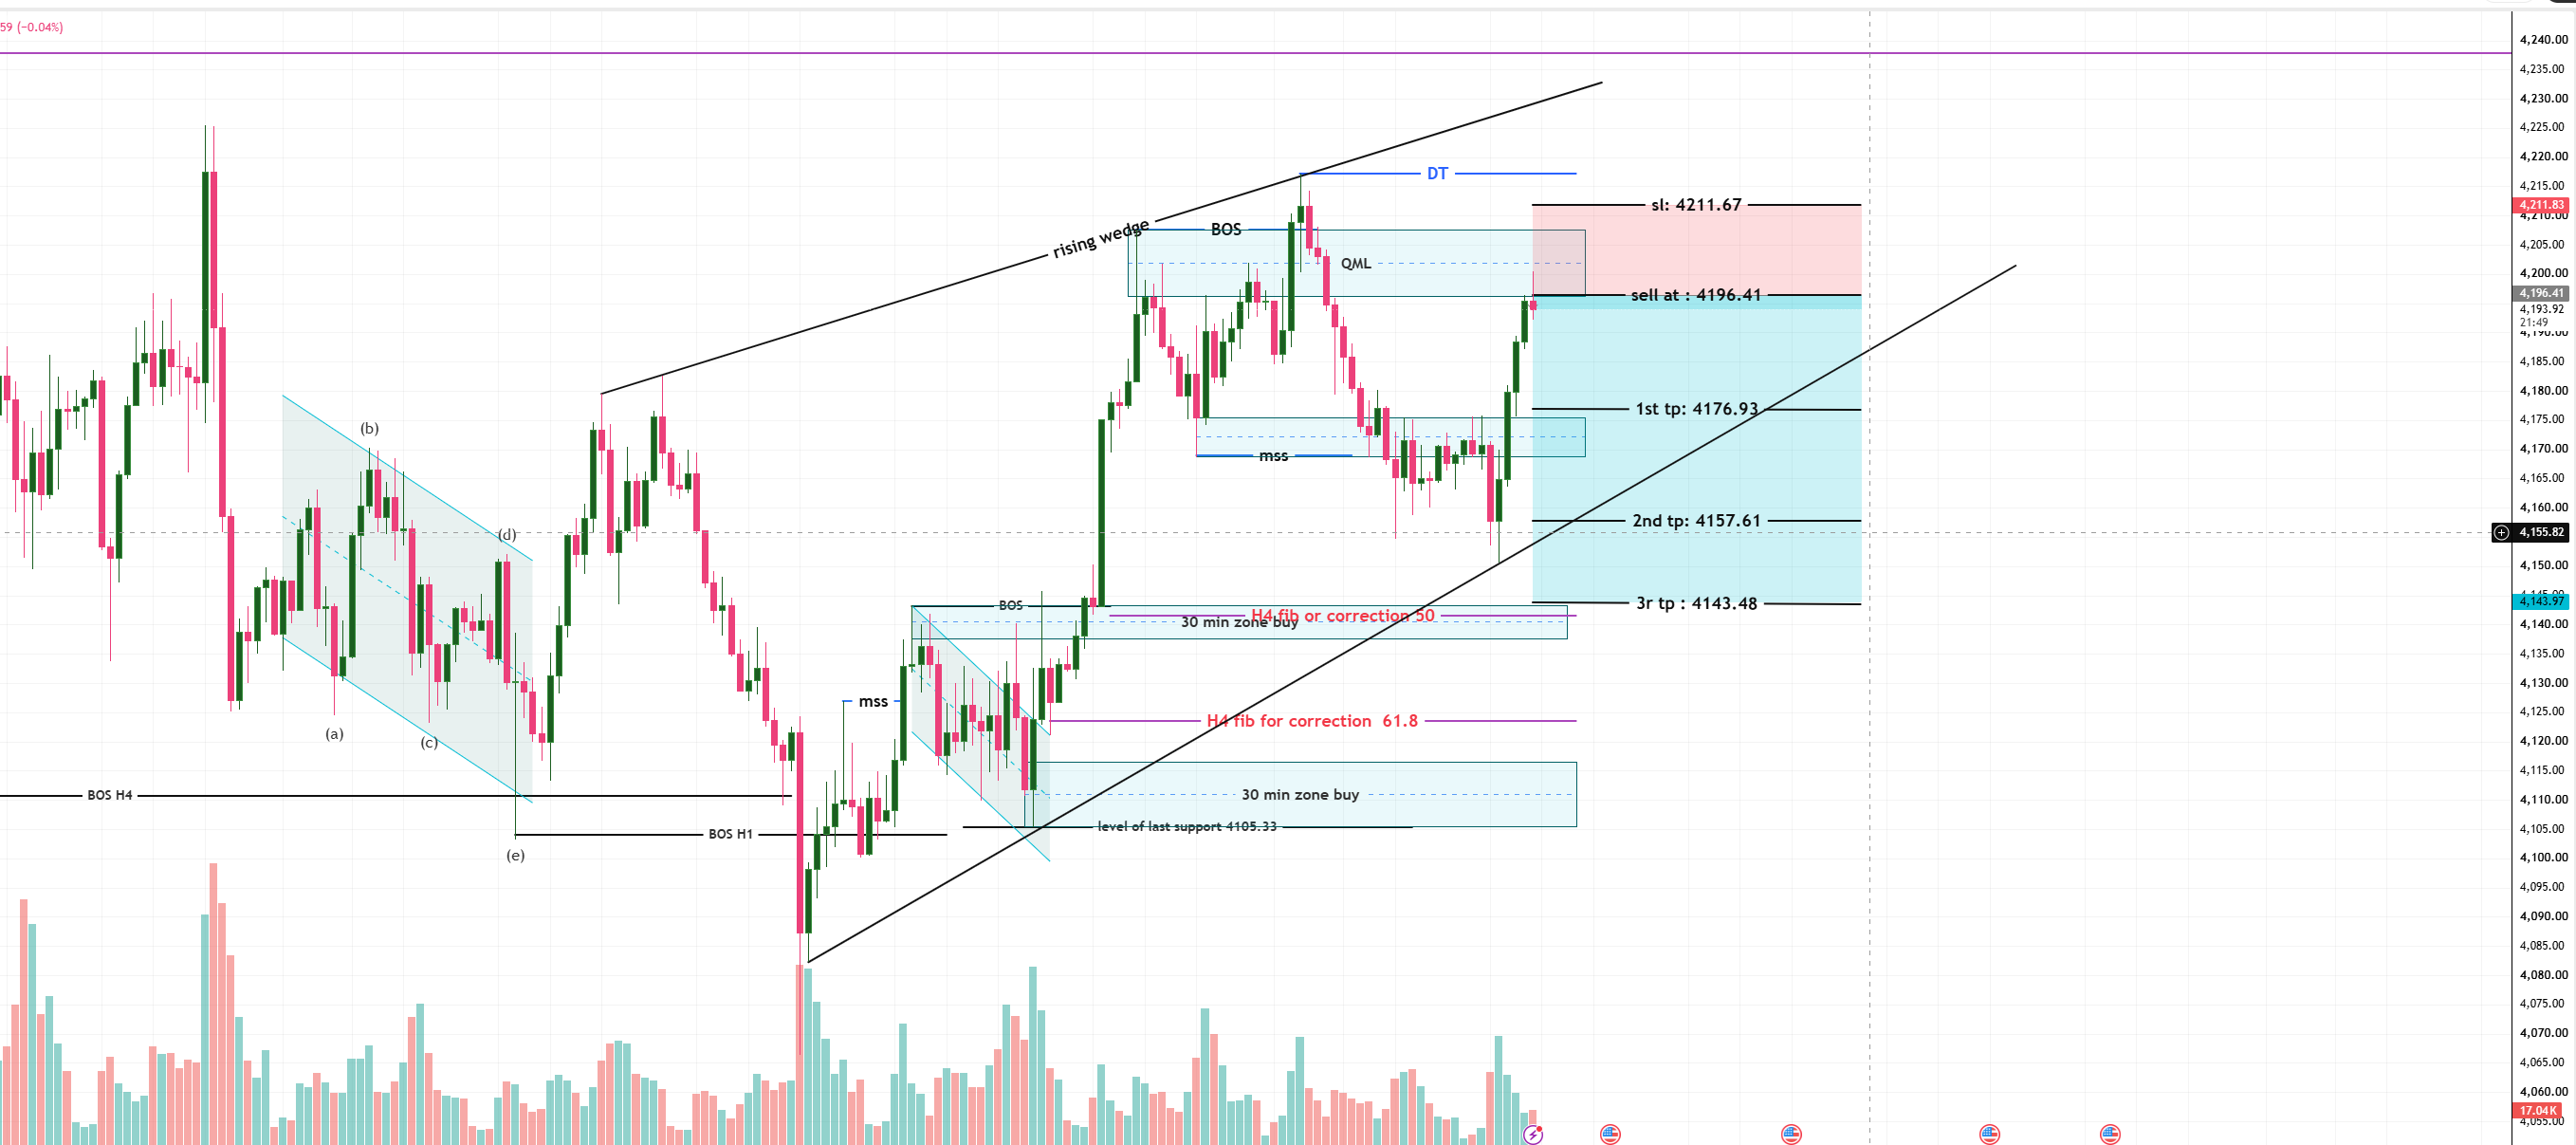
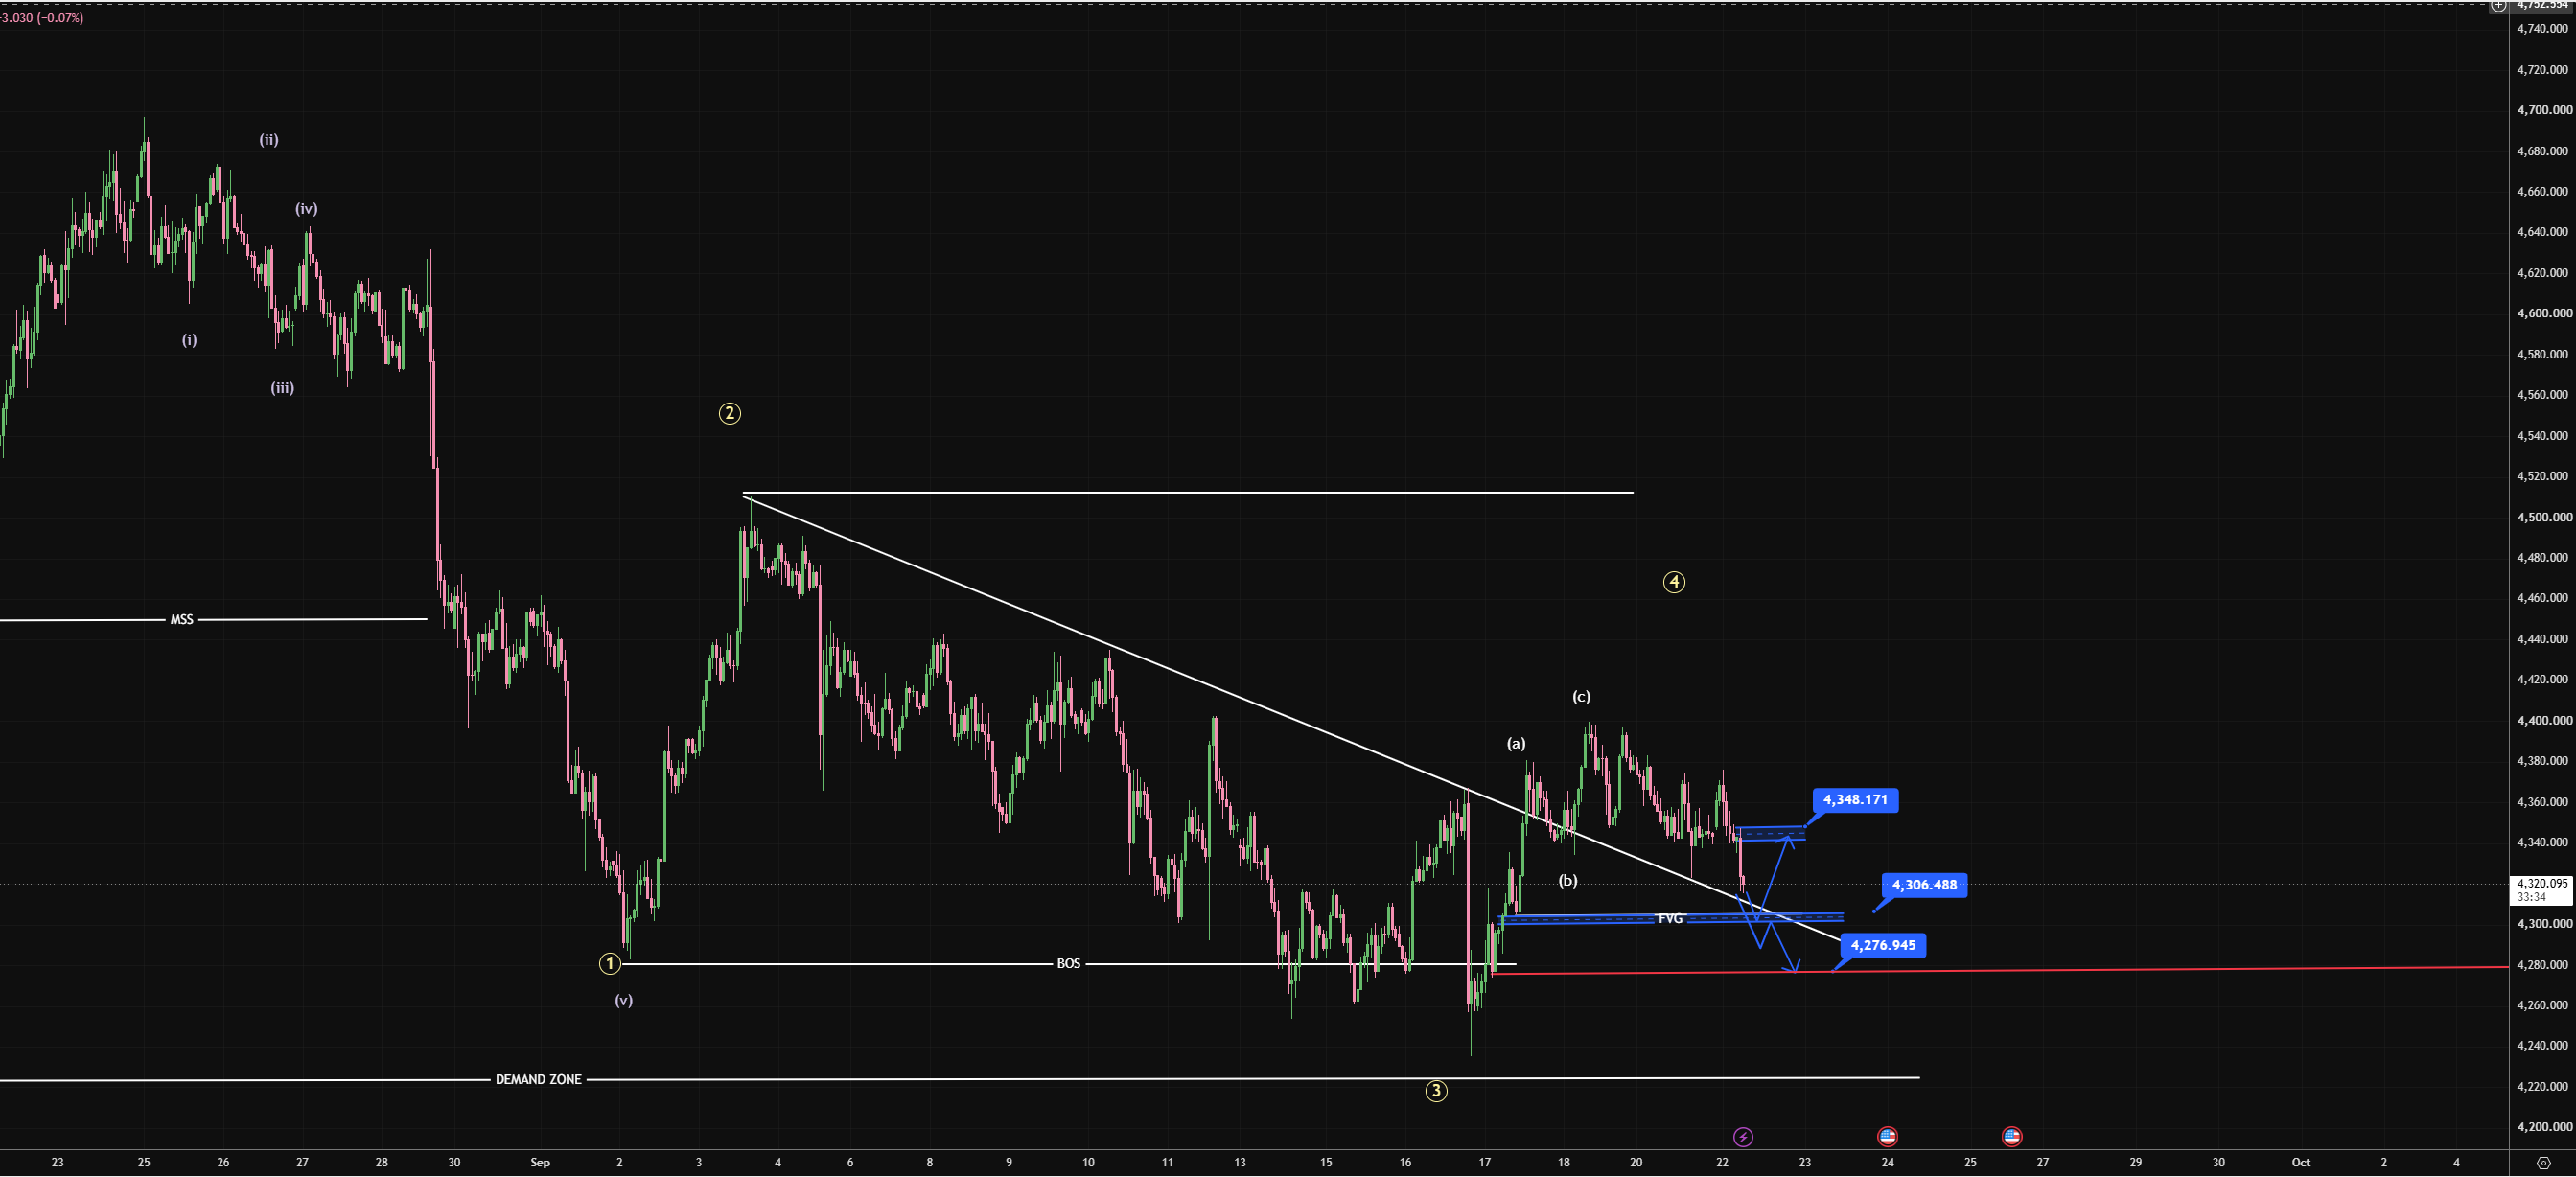
The chart highlights a classic combination of Elliott Wave theory and Smart Money Concepts (SMC) price action. Following a significant downward impulsive move, price has completed major Wave 1 and Wave 2 legs and is currently completing corrective structures within a broader consolidation range.
Macro Movement: An earlier five-wave impulse downward (i)-(ii)-(iii)-(iv)-(v) led to the formation of primary Wave 1.
Wave 2 & Wave 3: After a corrective rally into Wave 2, price broke below previous lows—confirming a Break of Structure (BOS).
Wave 3 to Wave 4 Correction: Price hit a swing low at Wave 3 just above the higher-timeframe Demand Zone. The recent recovery formed an (a)-(b)-(c) corrective sequence inside Wave 4.
Fair Value Gap (FVG) / Demand Area: ~4,300.00 – 4,306.48
Lower Invalidations / Support Level: 4,276.94
Upper Target / Resistance Level: 4,348.17
Macro Demand Zone: ~4,220.00
Price retraces into the FVG / Support Area around 4,300–4,306. If buyers defend this zone, expect a bounce targeting upper liquidity at 4,348.17.
A deeper push past the FVG toward the support base at 4,276.94. A rejection at this level maintains structural integrity for a move back up toward 4,306.48 and higher.
Disclaimer: Educational content only. Trading financial instruments carries high risk. Always manage your risk according to your strategy.