 Mobarok Hossain
 April 25, 2024
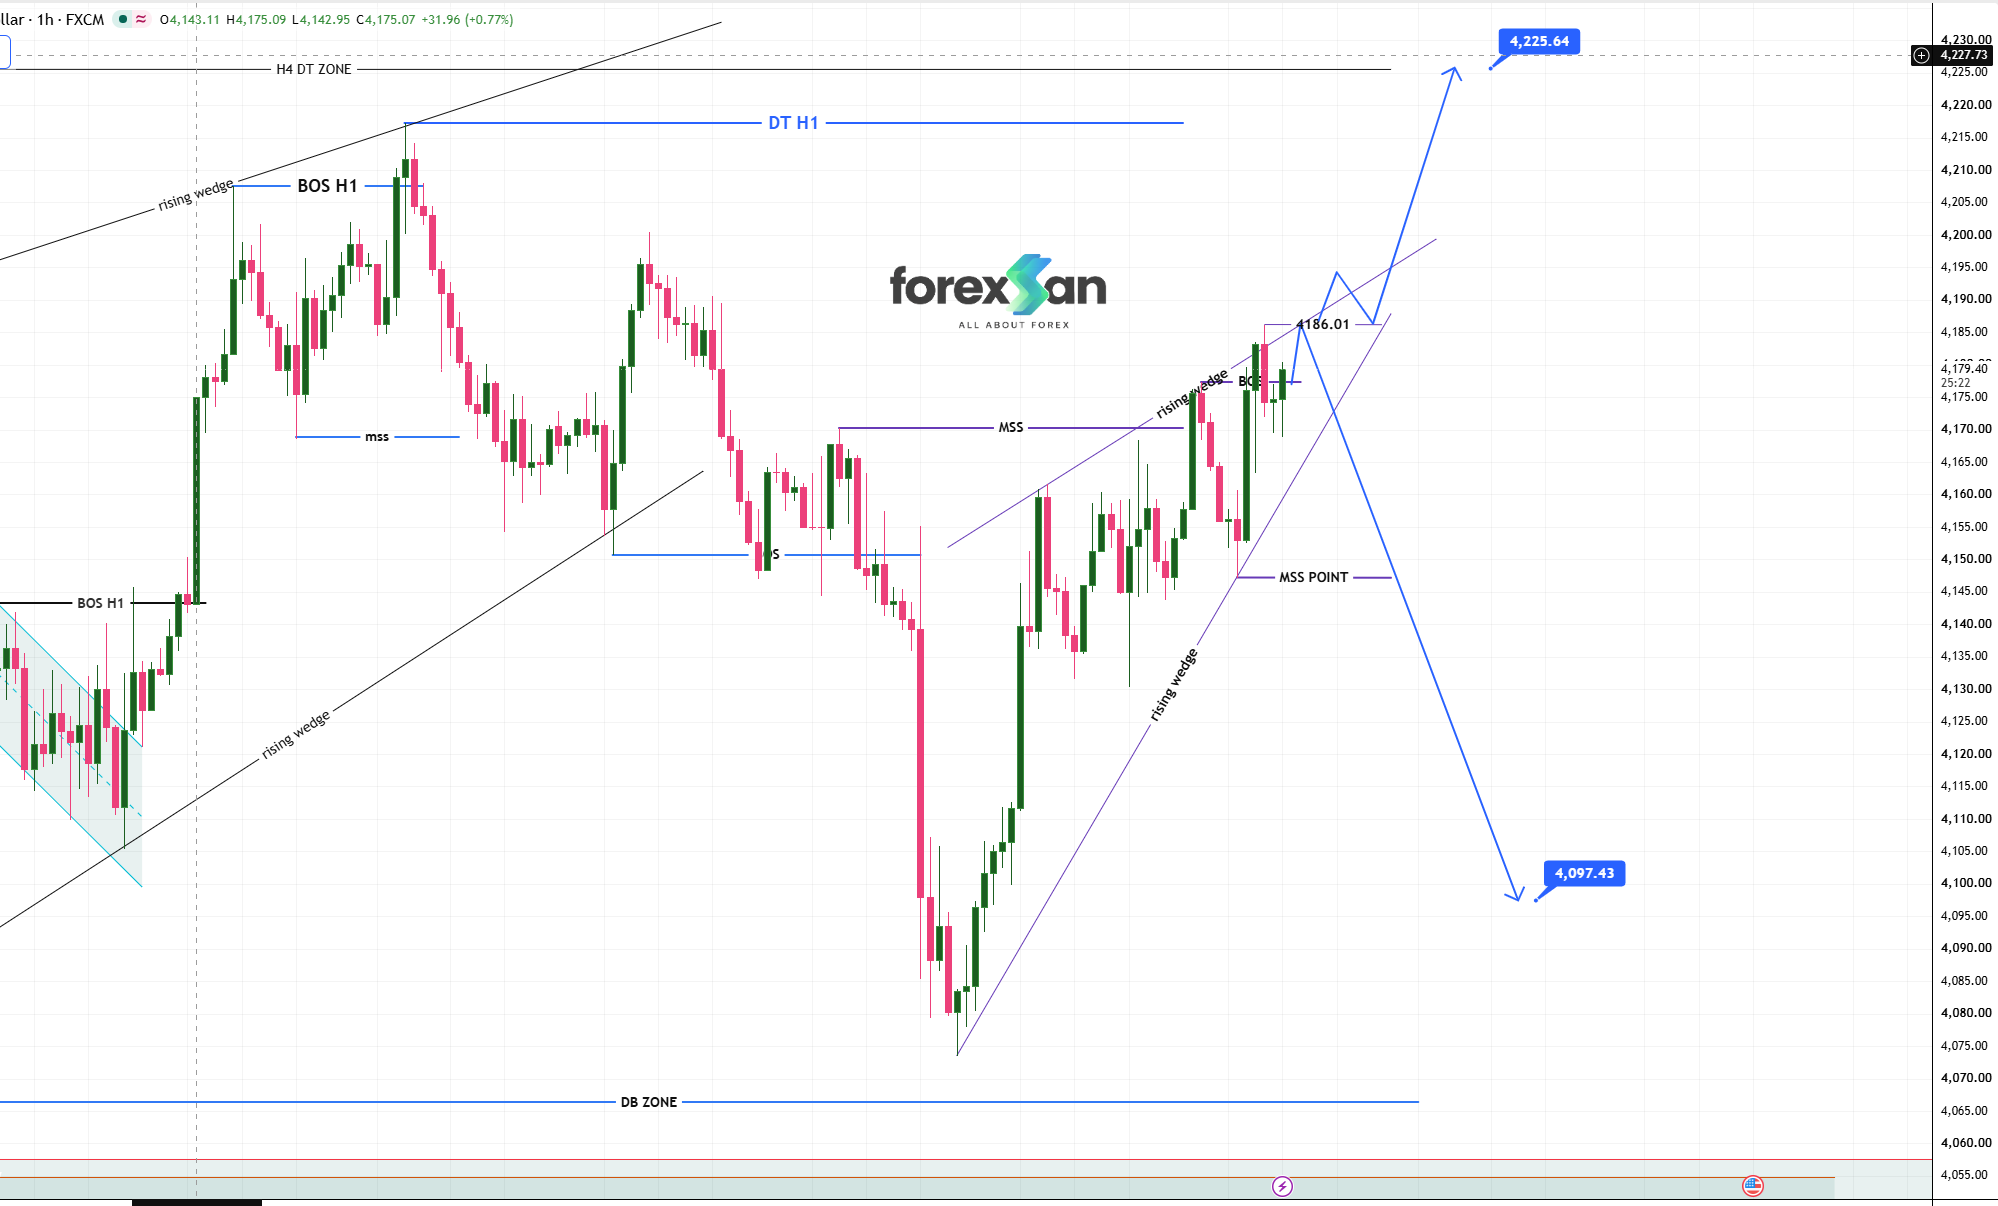
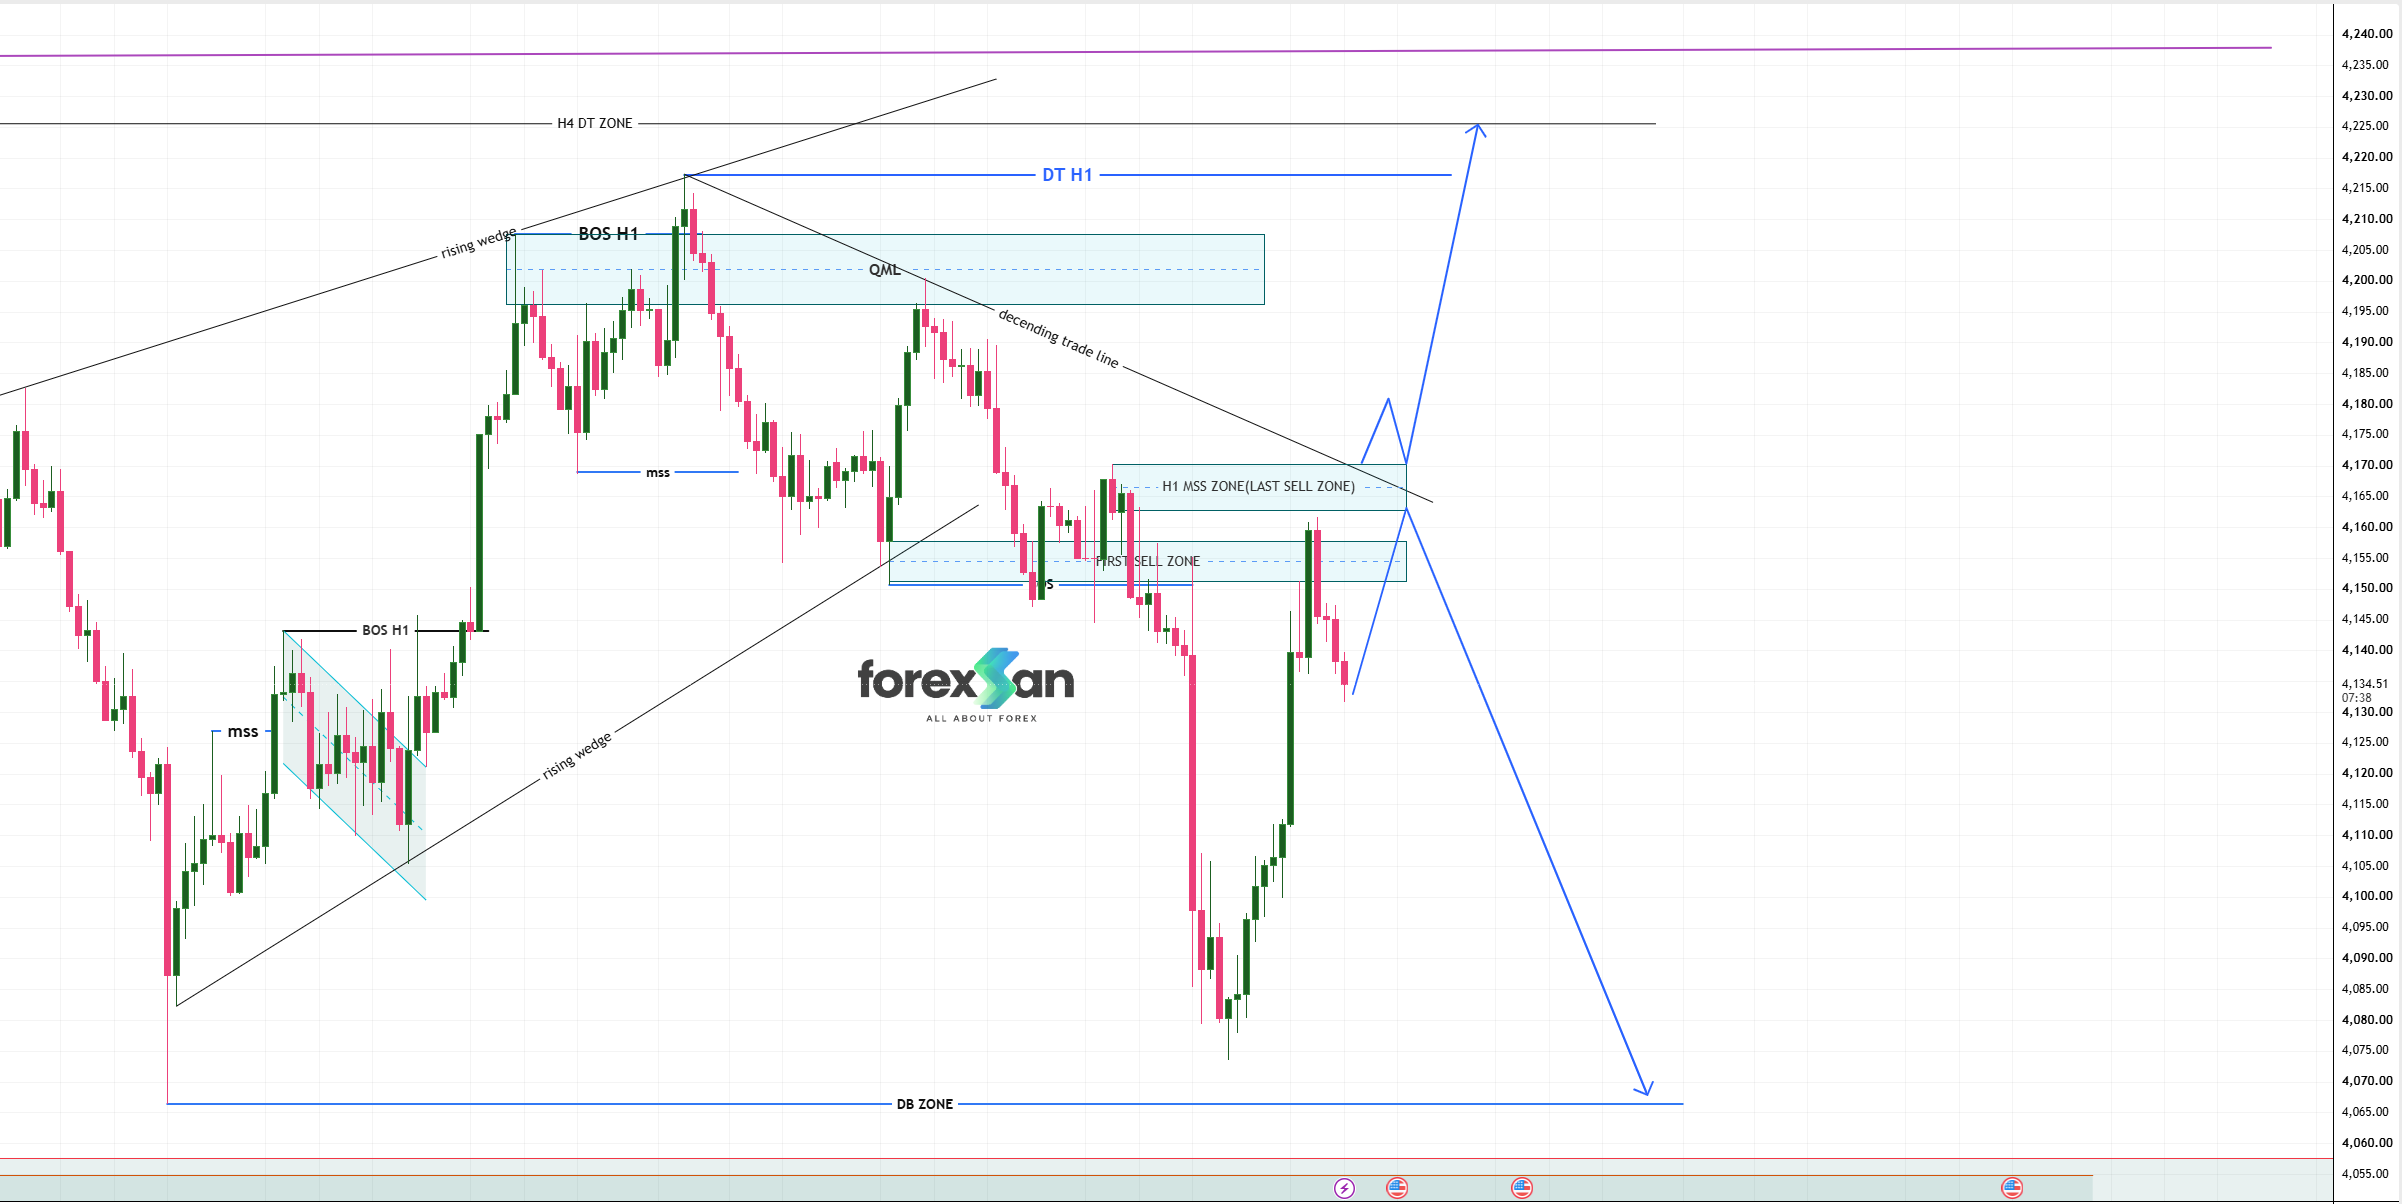
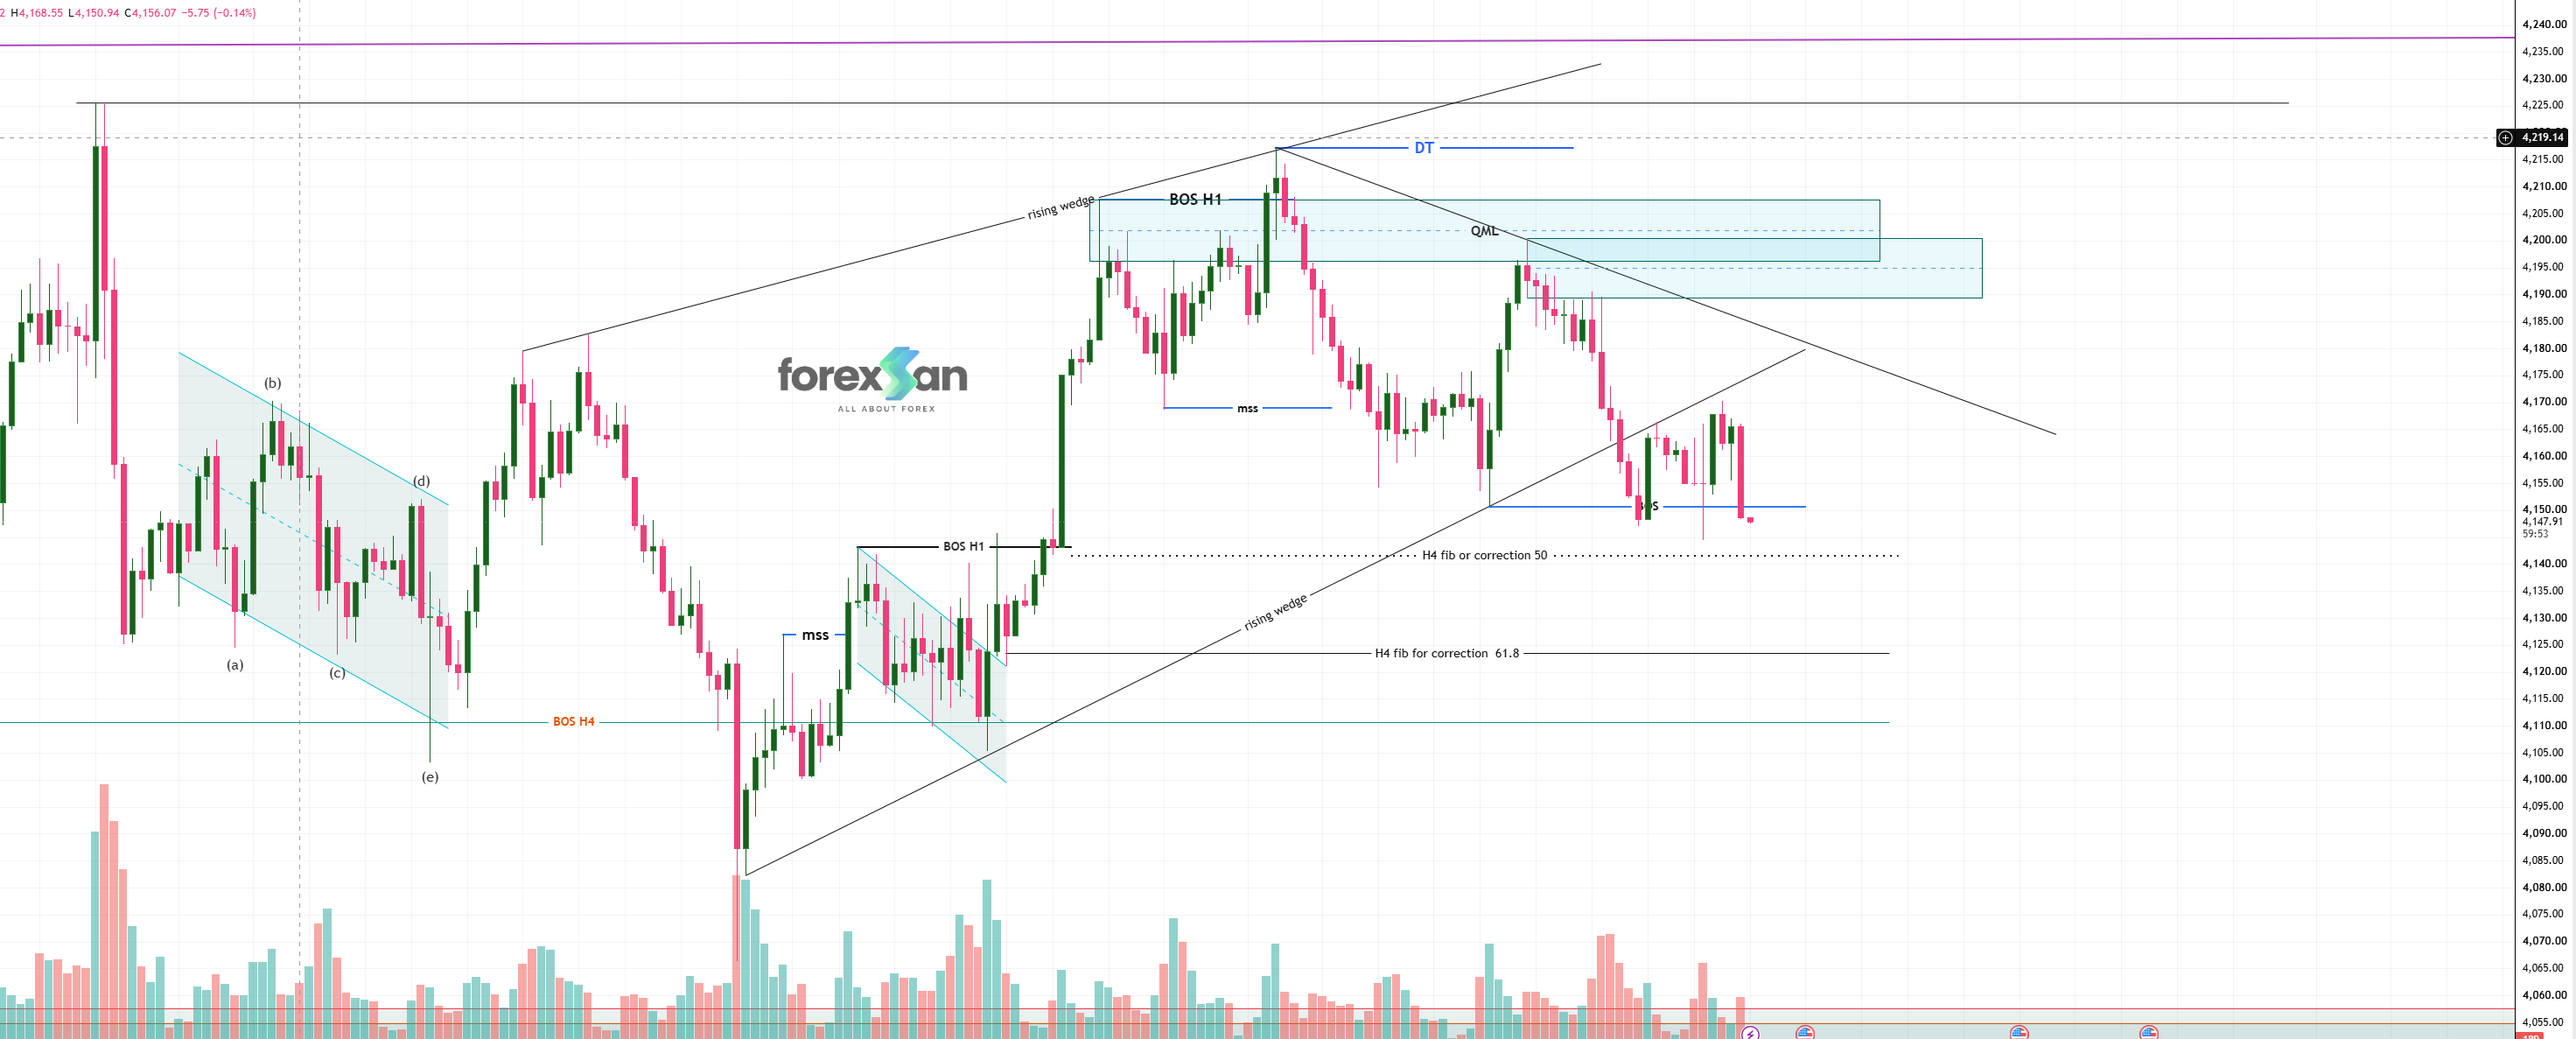
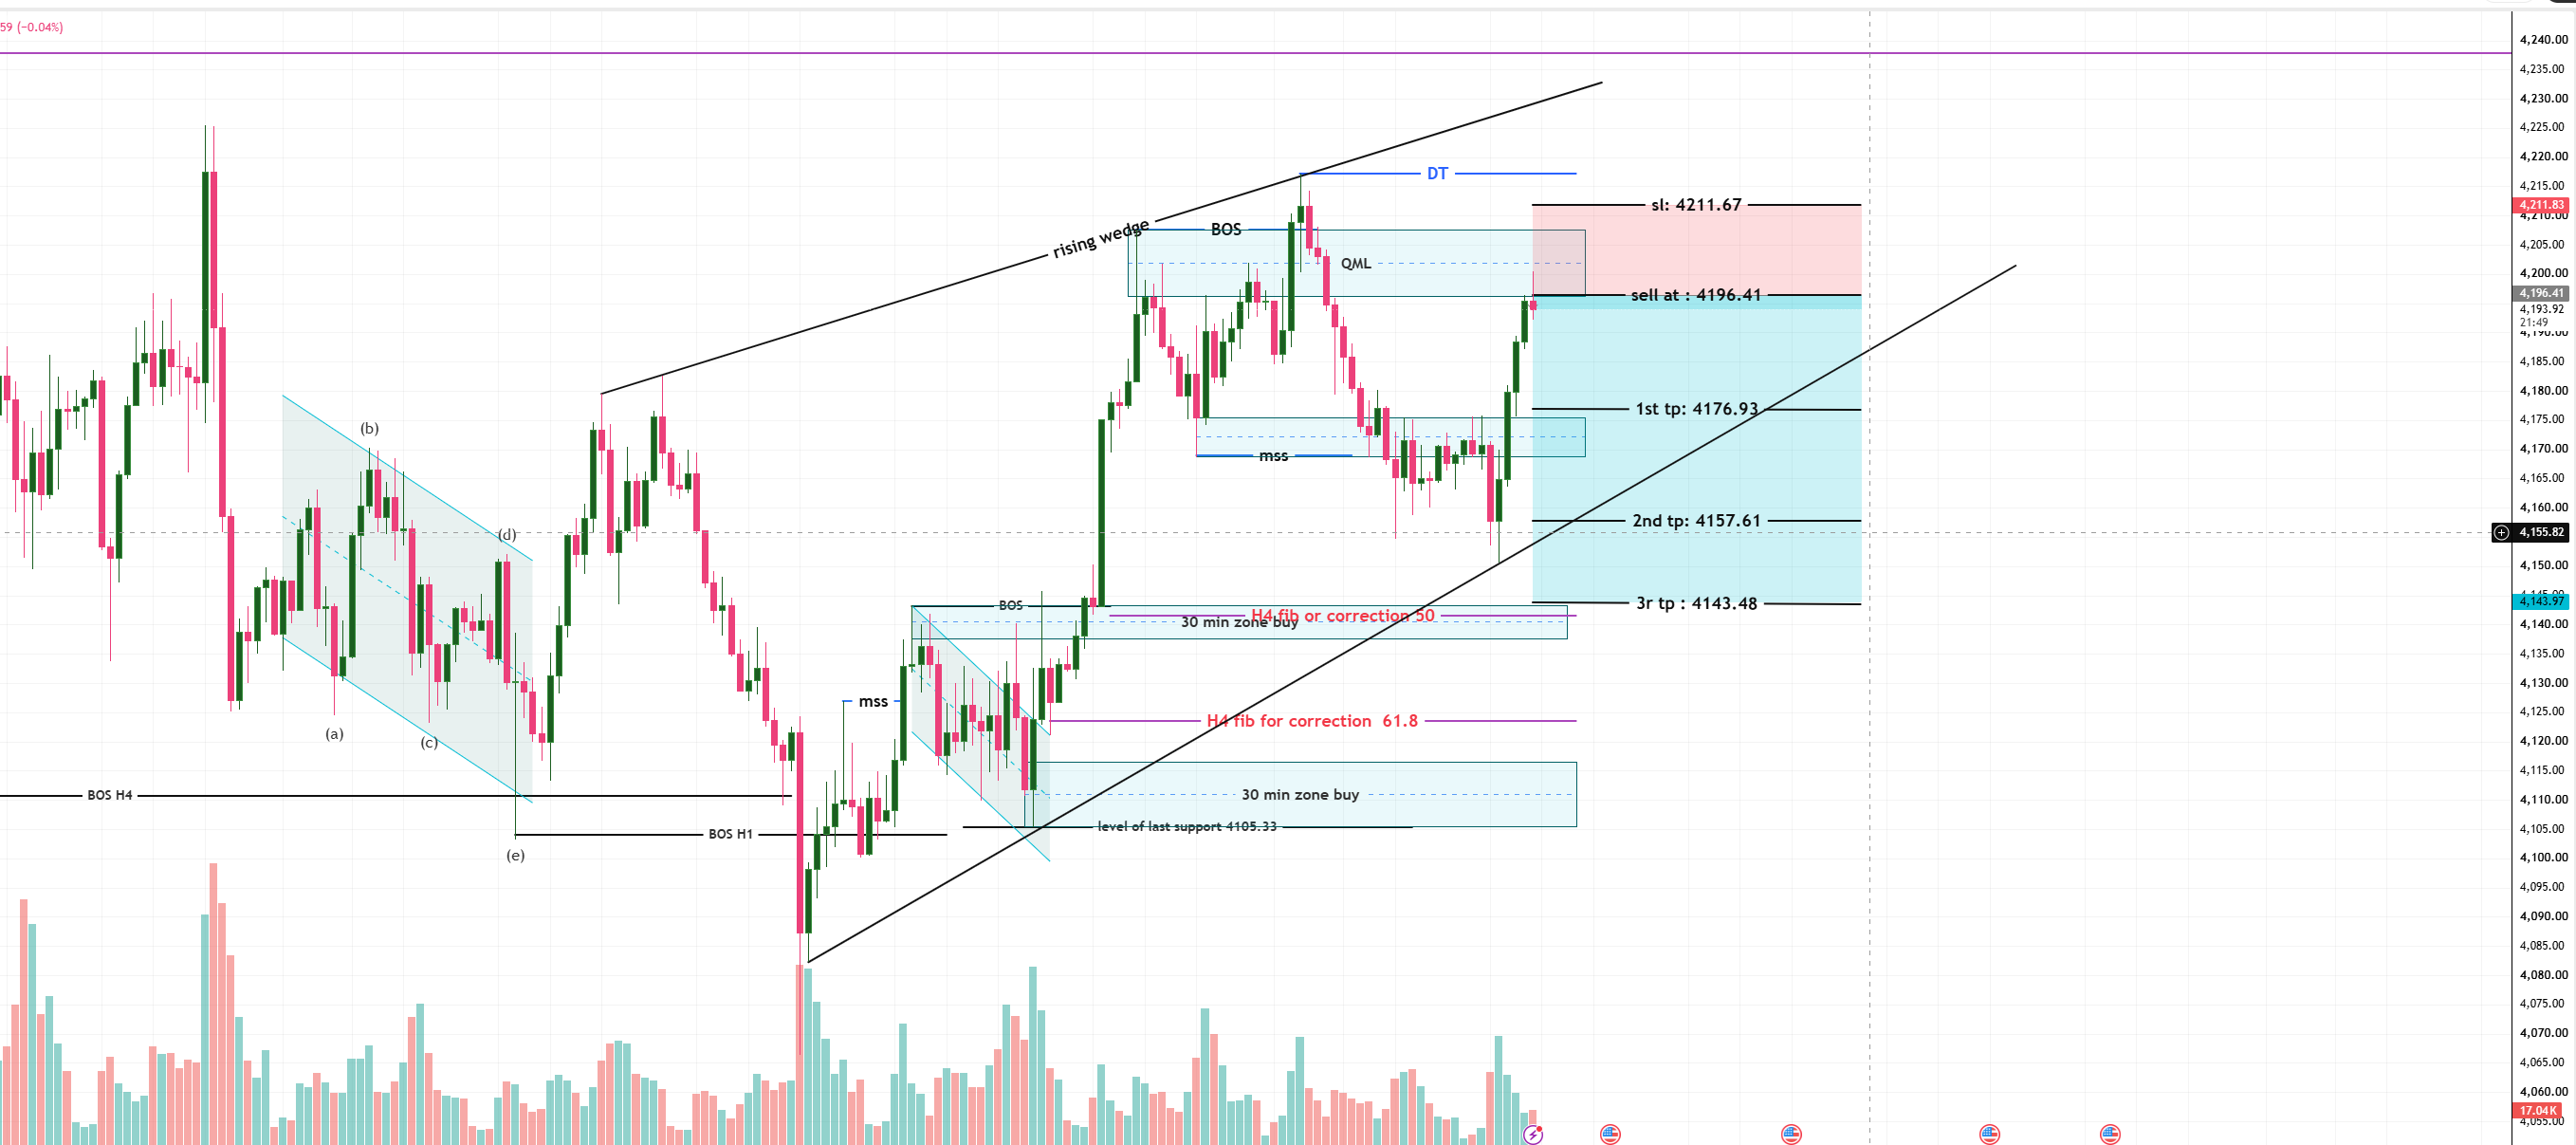
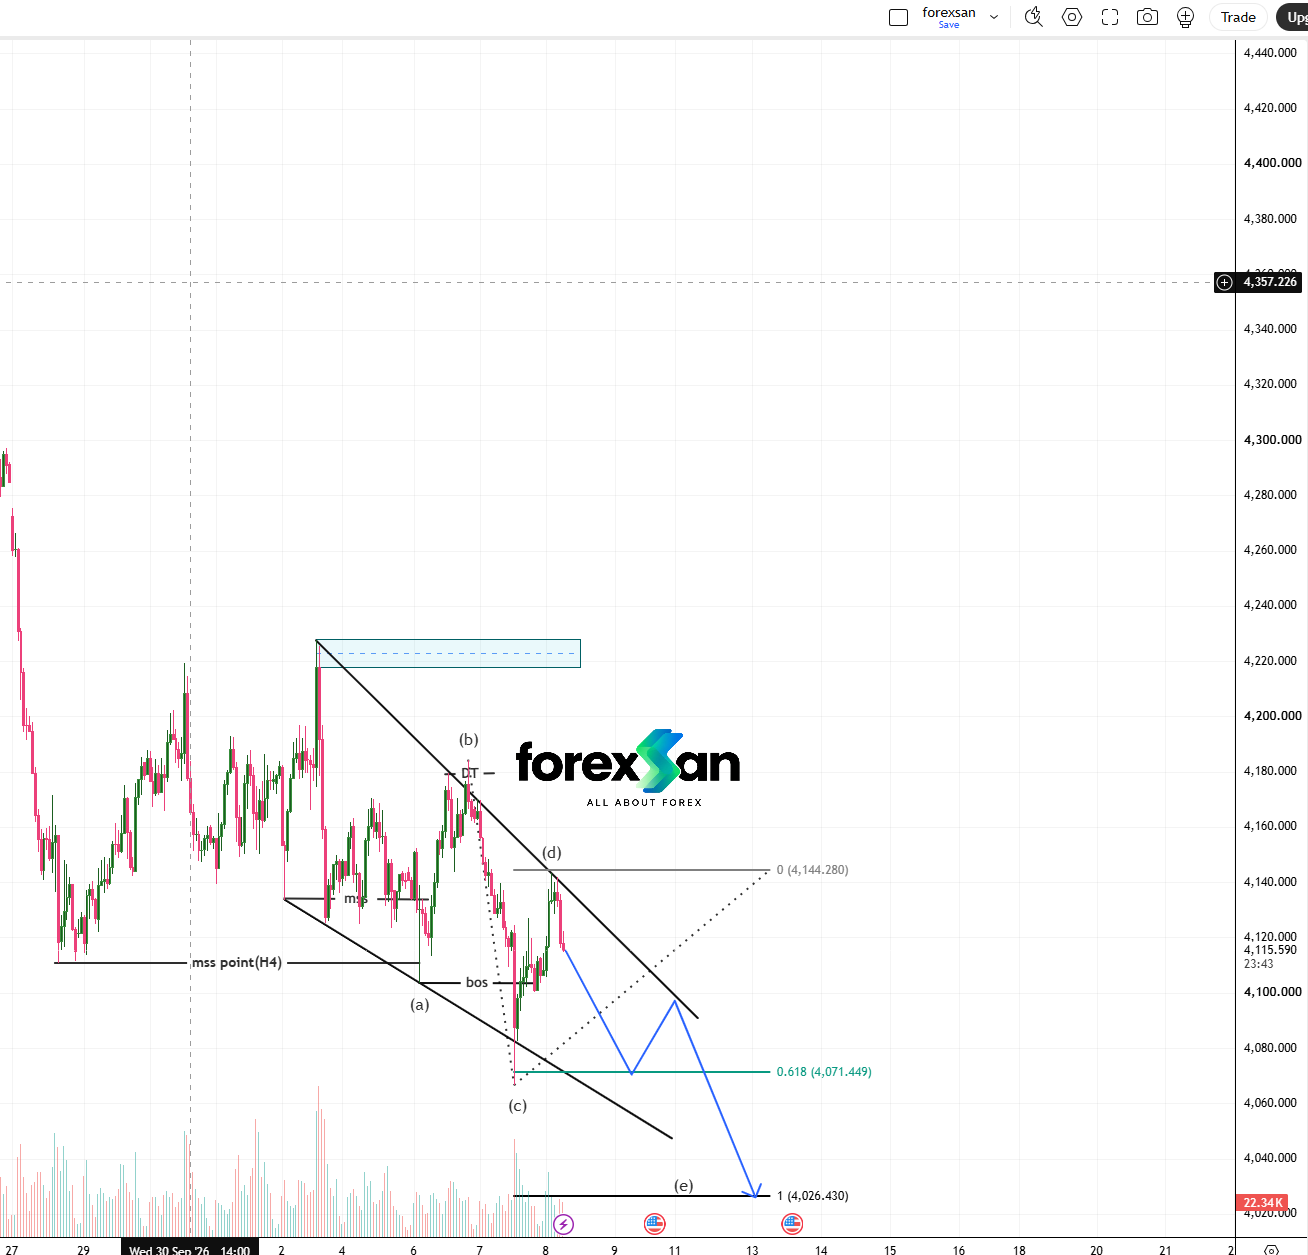
Overview Spot Gold (XAU/USD) continues to trade inside a structured descending wedge pattern, developing an (a)-(b)-(c)-(d)-(e) corrective sequence. Following a rejection at sub-wave (d) near 4,144.280, price action has resumed its downward push, targeting lower Fibonacci extension levels and structural wedge support.
Sub-Wave (d) Rejection: The corrective move upward was capped at 4,144.280 (0 Fib level), confirming overhead selling pressure.
4H Market Structure Shift (MSS Point): Previous structural breakdown points confirm sustained medium-term bearish order flow.
0.618 Fibonacci Support: The first intermediate target for the current impulse sits at 4,071.449 (0.618 Fib retracement).
Wave (e) Completion Target: The final downside target for this pattern aligns with the 1.0 Fibonacci projection at 4,026.430, intersecting with the lower boundary of the descending wedge.
Trigger: Sustained momentum below 4,115.590.
Target 1: 4,071.449 (0.618 Fib / Intermediate Support)
Target 2: 4,026.430 (1.0 Fib / Wave e Wedge Target)
Invalidation: A 1H candle close above 4,144.280 invalidates the immediate wedge continuation setup.
Traders should closely monitor price behavior around 4,071.449 for lower-timeframe execution signals, keeping the primary focus on the completion of Wave (e) at 4,026.430.
Disclaimer: This analysis is provided for educational purposes only and does not constitute financial advice.