 Mobarok Hossain
 April 25, 2024
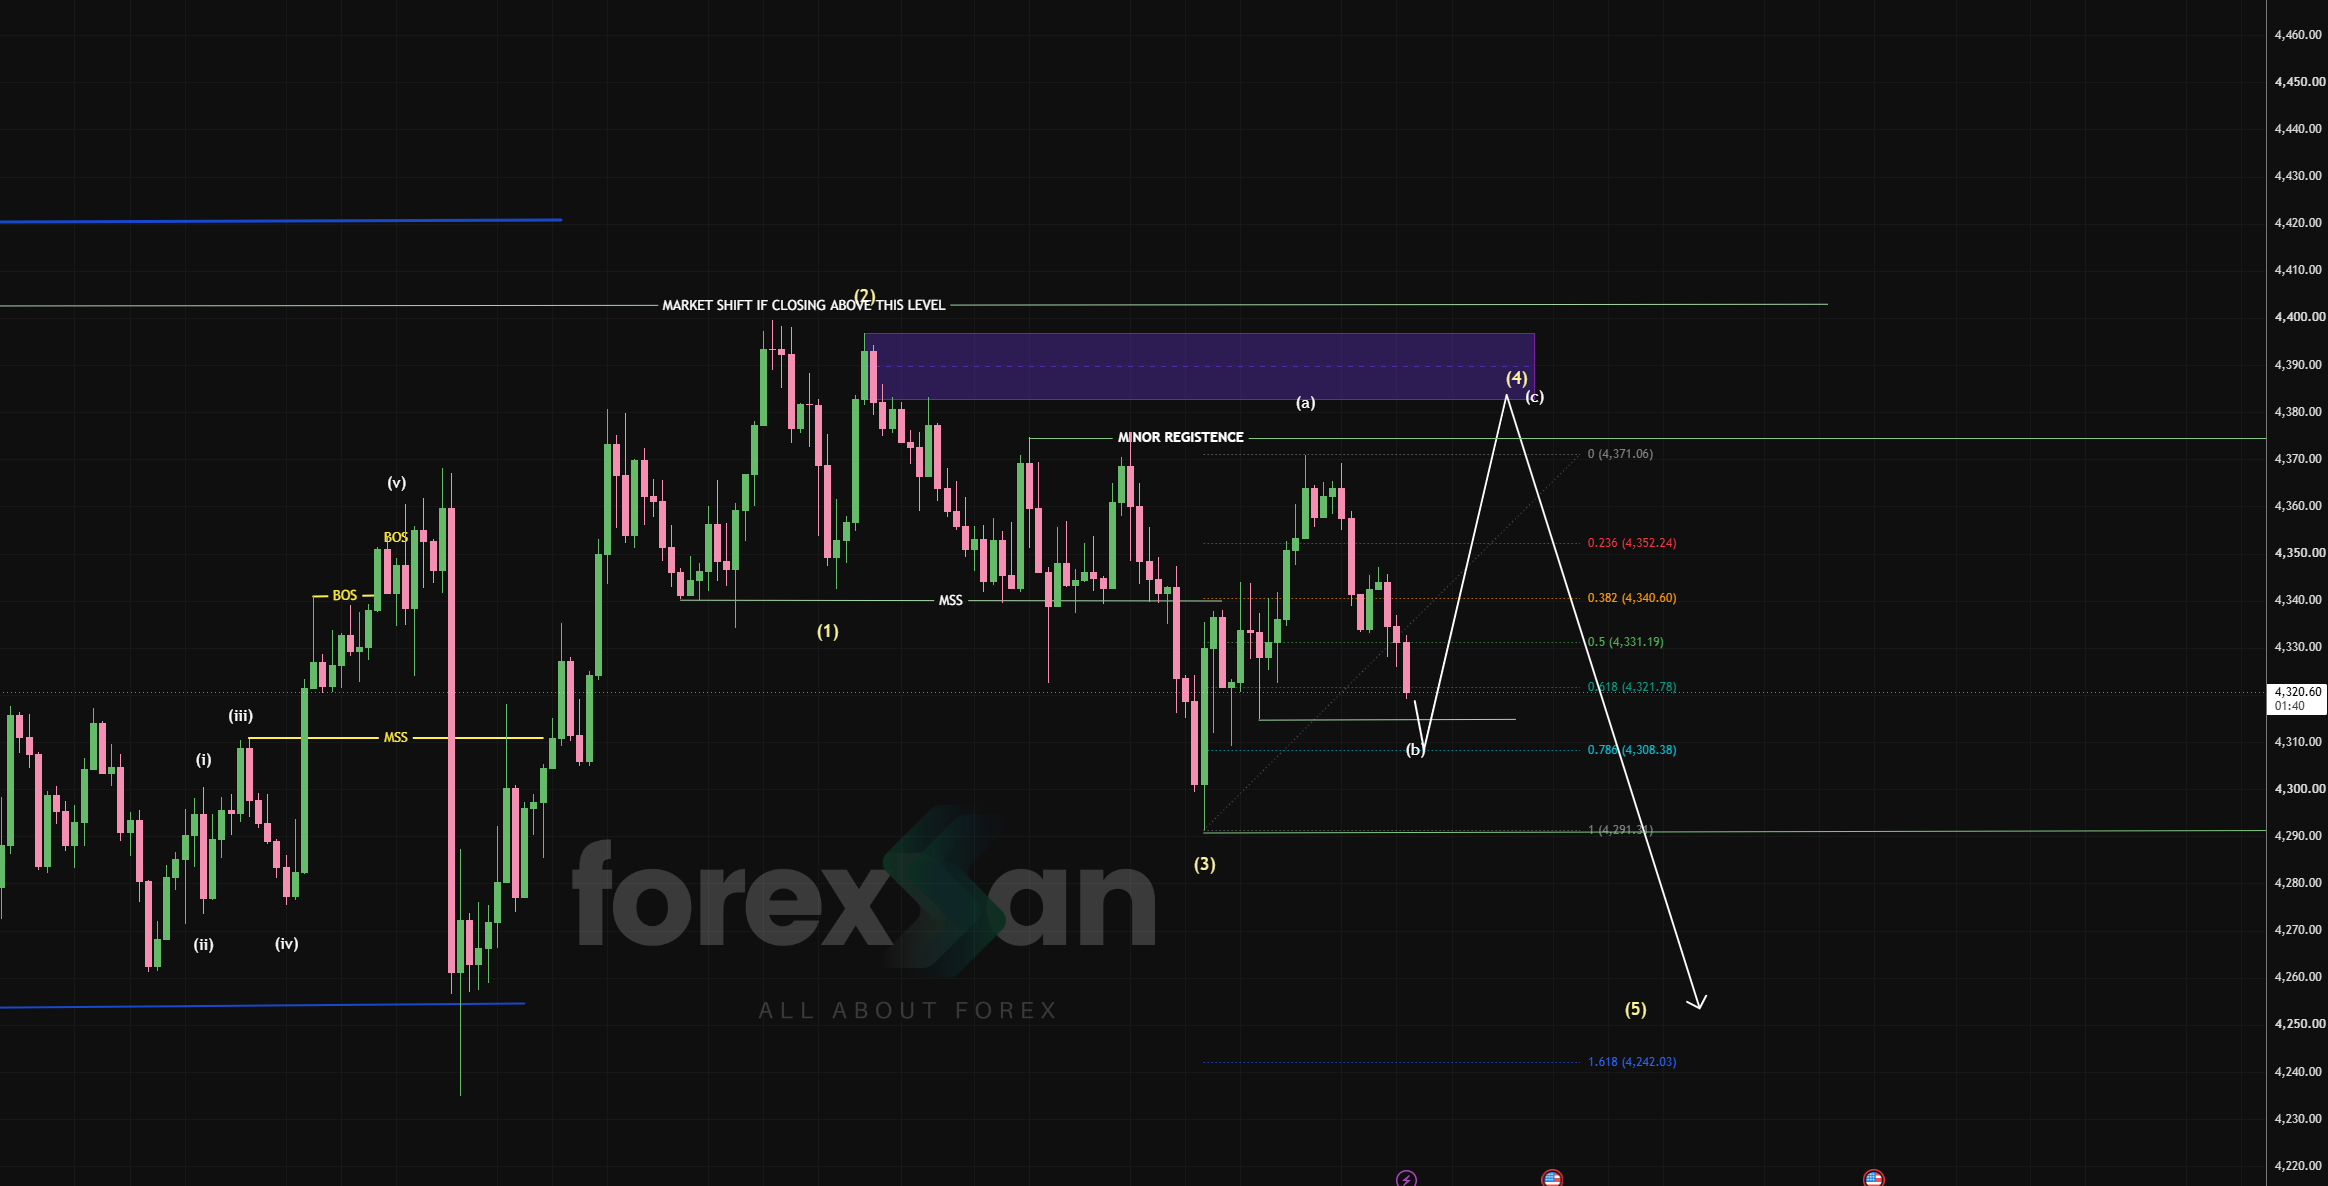
Gold (XAU/USD) is trading within a structured 5-wave bearish sequence on the 1-hour timeframe. Following the completion of Wave (3) near 4,291.31, price action is currently developing a Wave (4) corrective retracement before the anticipated final Wave (5) impulse downward.
Technical Breakdown
Elliott Wave Count:
Wave (3) bottomed at 4,291.31.
Wave (4) is currently unfolding as an (a)-(b)-(c) corrective structure.
Fibonacci Retracement Confluence:
0.618 Fib Level: 4,321.78 (Current active test zone)
0.382 / 0.5 Fib Levels: 4,340.60 / 4,331.19
Supply Block Resistance: Overhead supply between 4,380.00 and 4,400.00 acts as the primary reversal zone for Wave (c) of (4).
Market Shift Invalidation: A sustained 1H candle close above 4,400.00 shifts the structural bias to bullish.
Trading Strategy & Projections
Corrective Bounce (Wave 4):
Continuation up toward 4,380–4,400 to test the minor resistance and overhead supply zone.
Impulsive Sell-Off (Wave 5):
Trigger: Bearish rejection candlestick pattern inside the 4,380–4,400 supply block.
Target: 4,242.03 (1.618 Fibonacci Extension of Wave 5).
Conclusion Traders should monitor price action closely inside the 4,380–4,400 supply zone. Confirmation of a lower-timeframe Market Structure Shift (MSS) within this supply block will provide a high-probability entry for the Wave (5) sell-off down toward 4,242.03.
Disclaimer: This analysis is strictly for educational purposes and does not constitute financial advice.