 Mobarok Hossain
 April 25, 2024
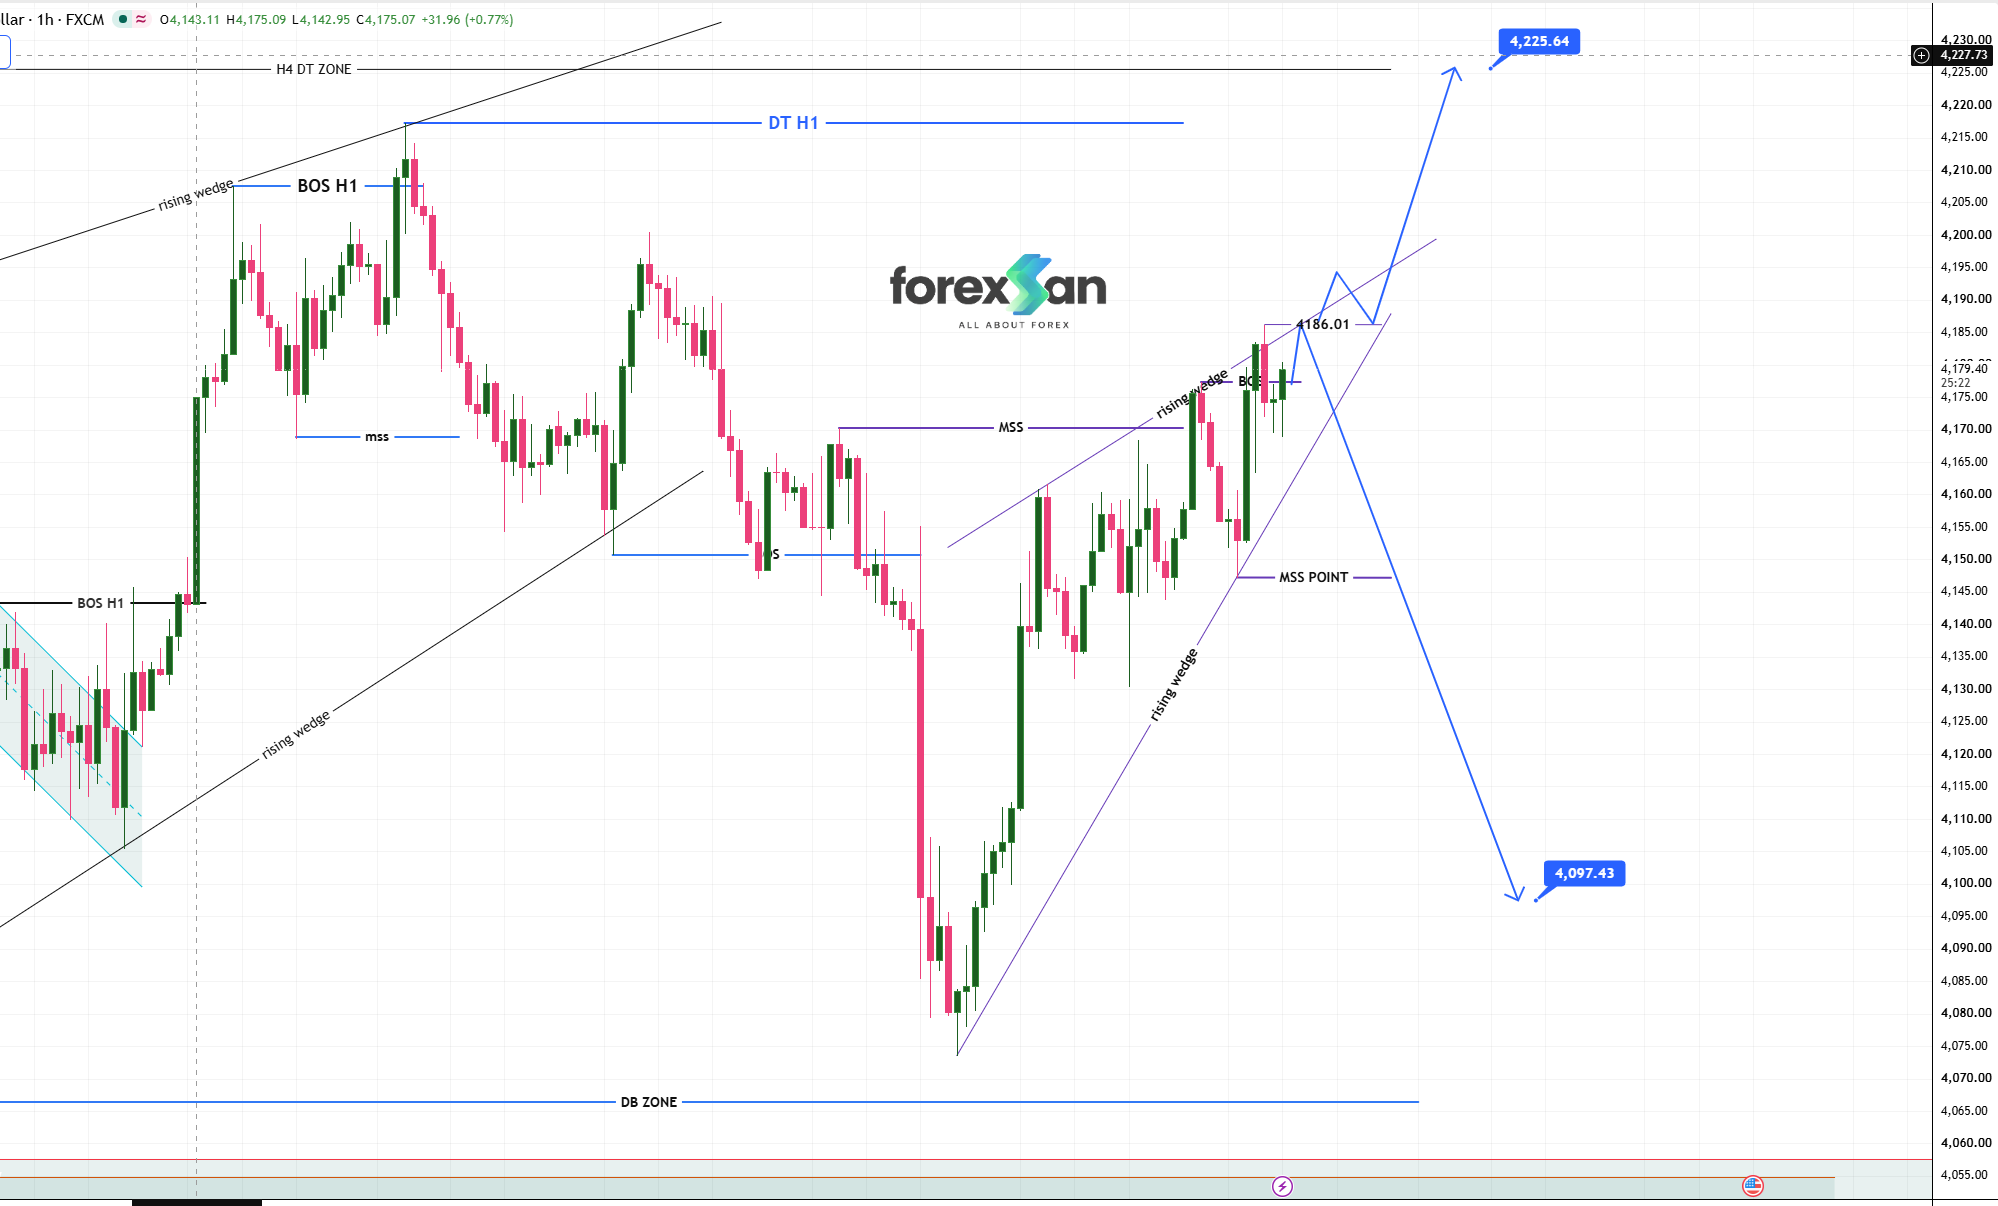
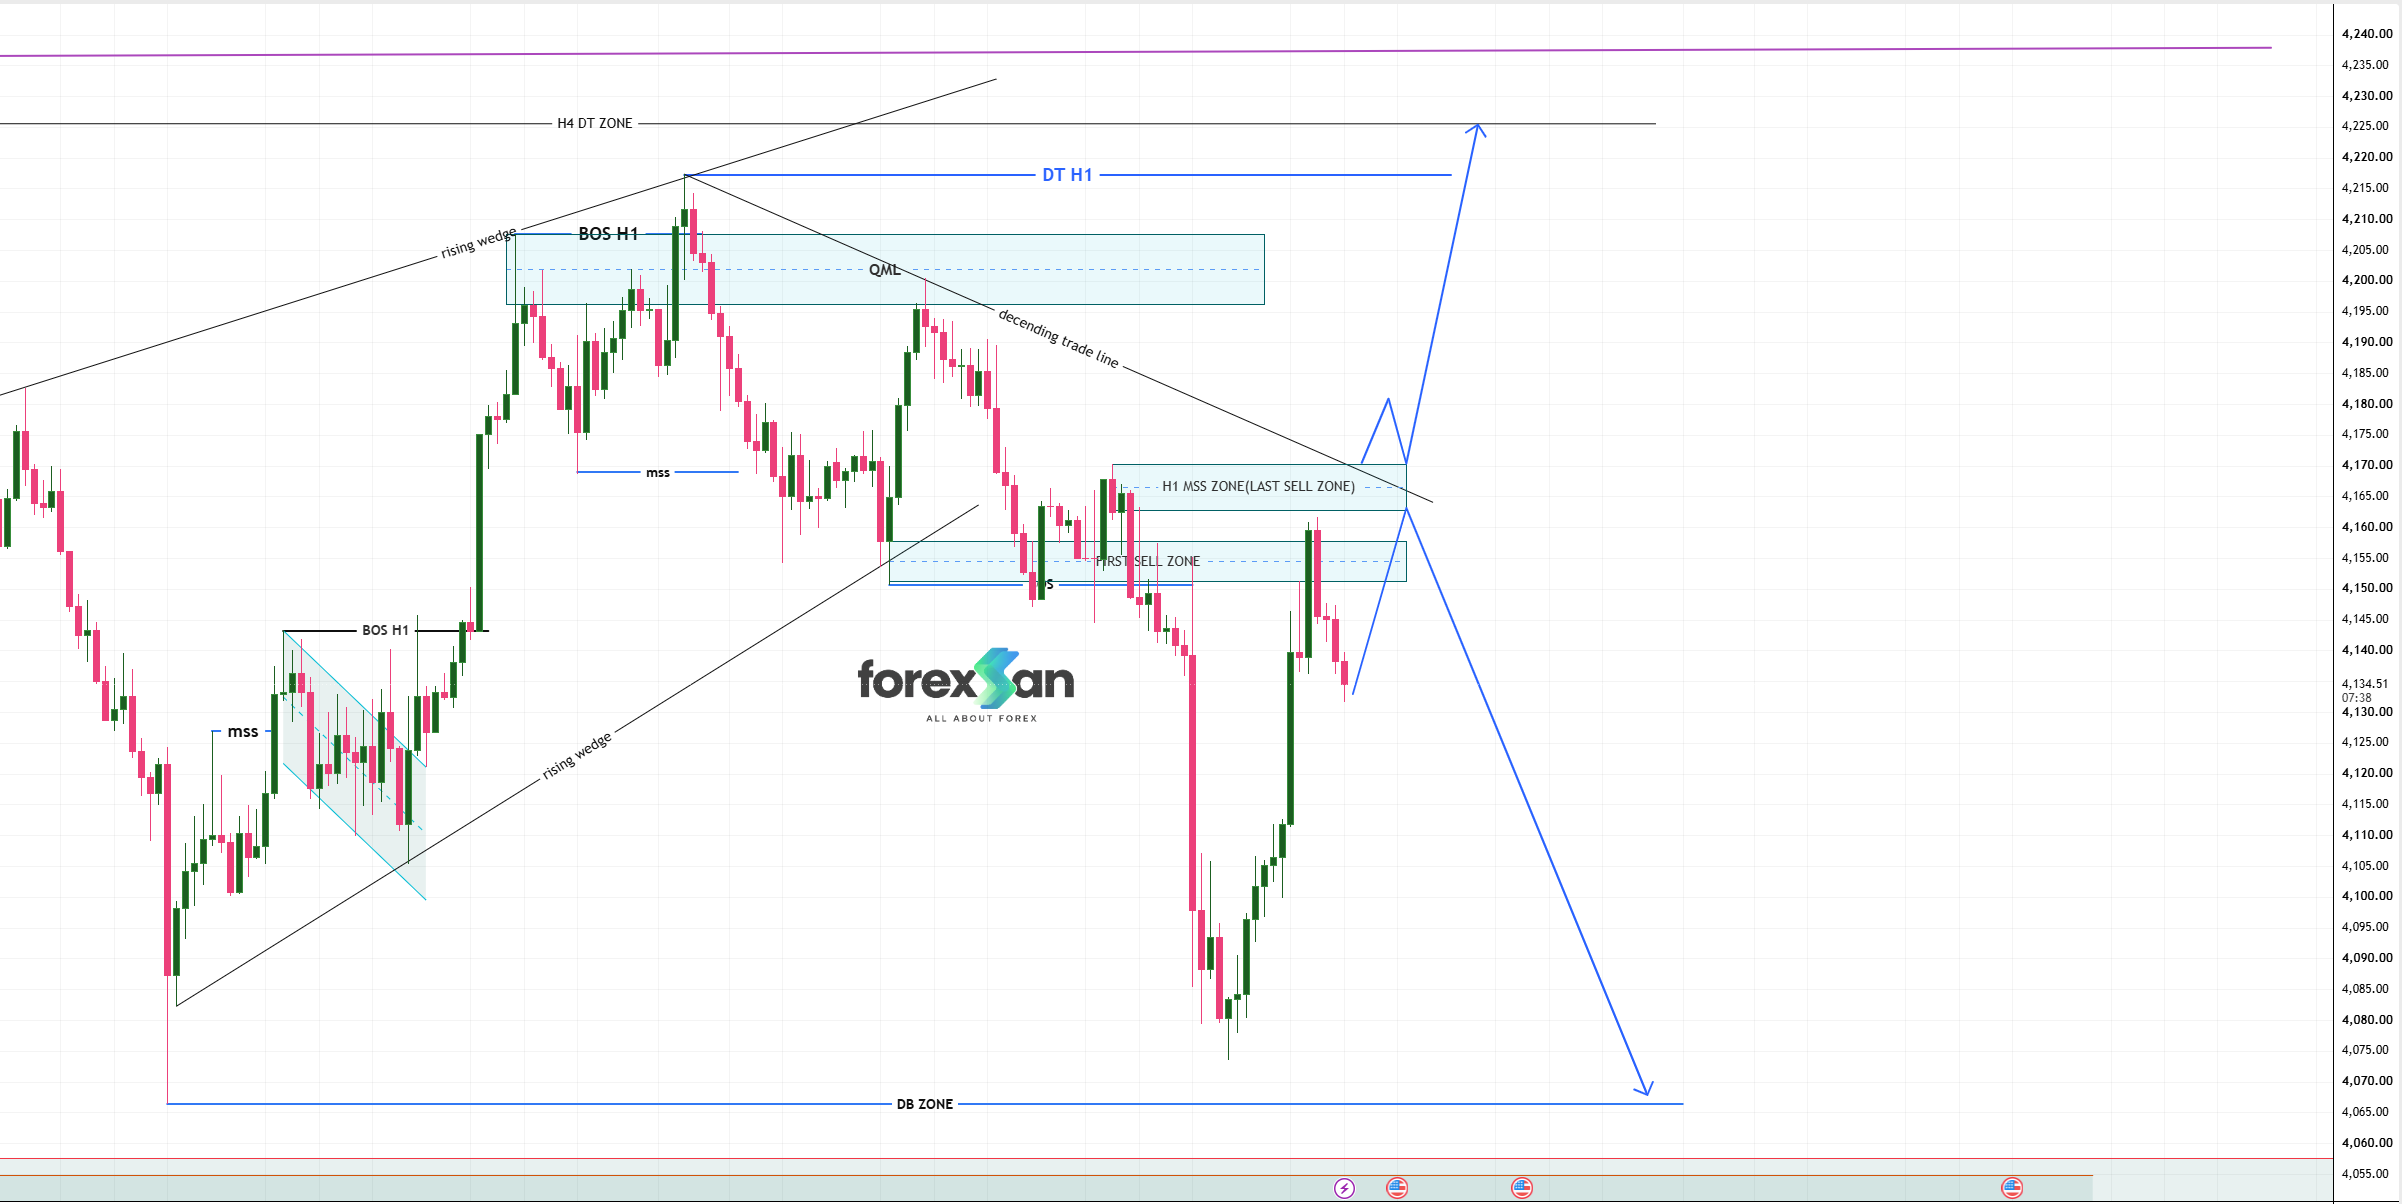
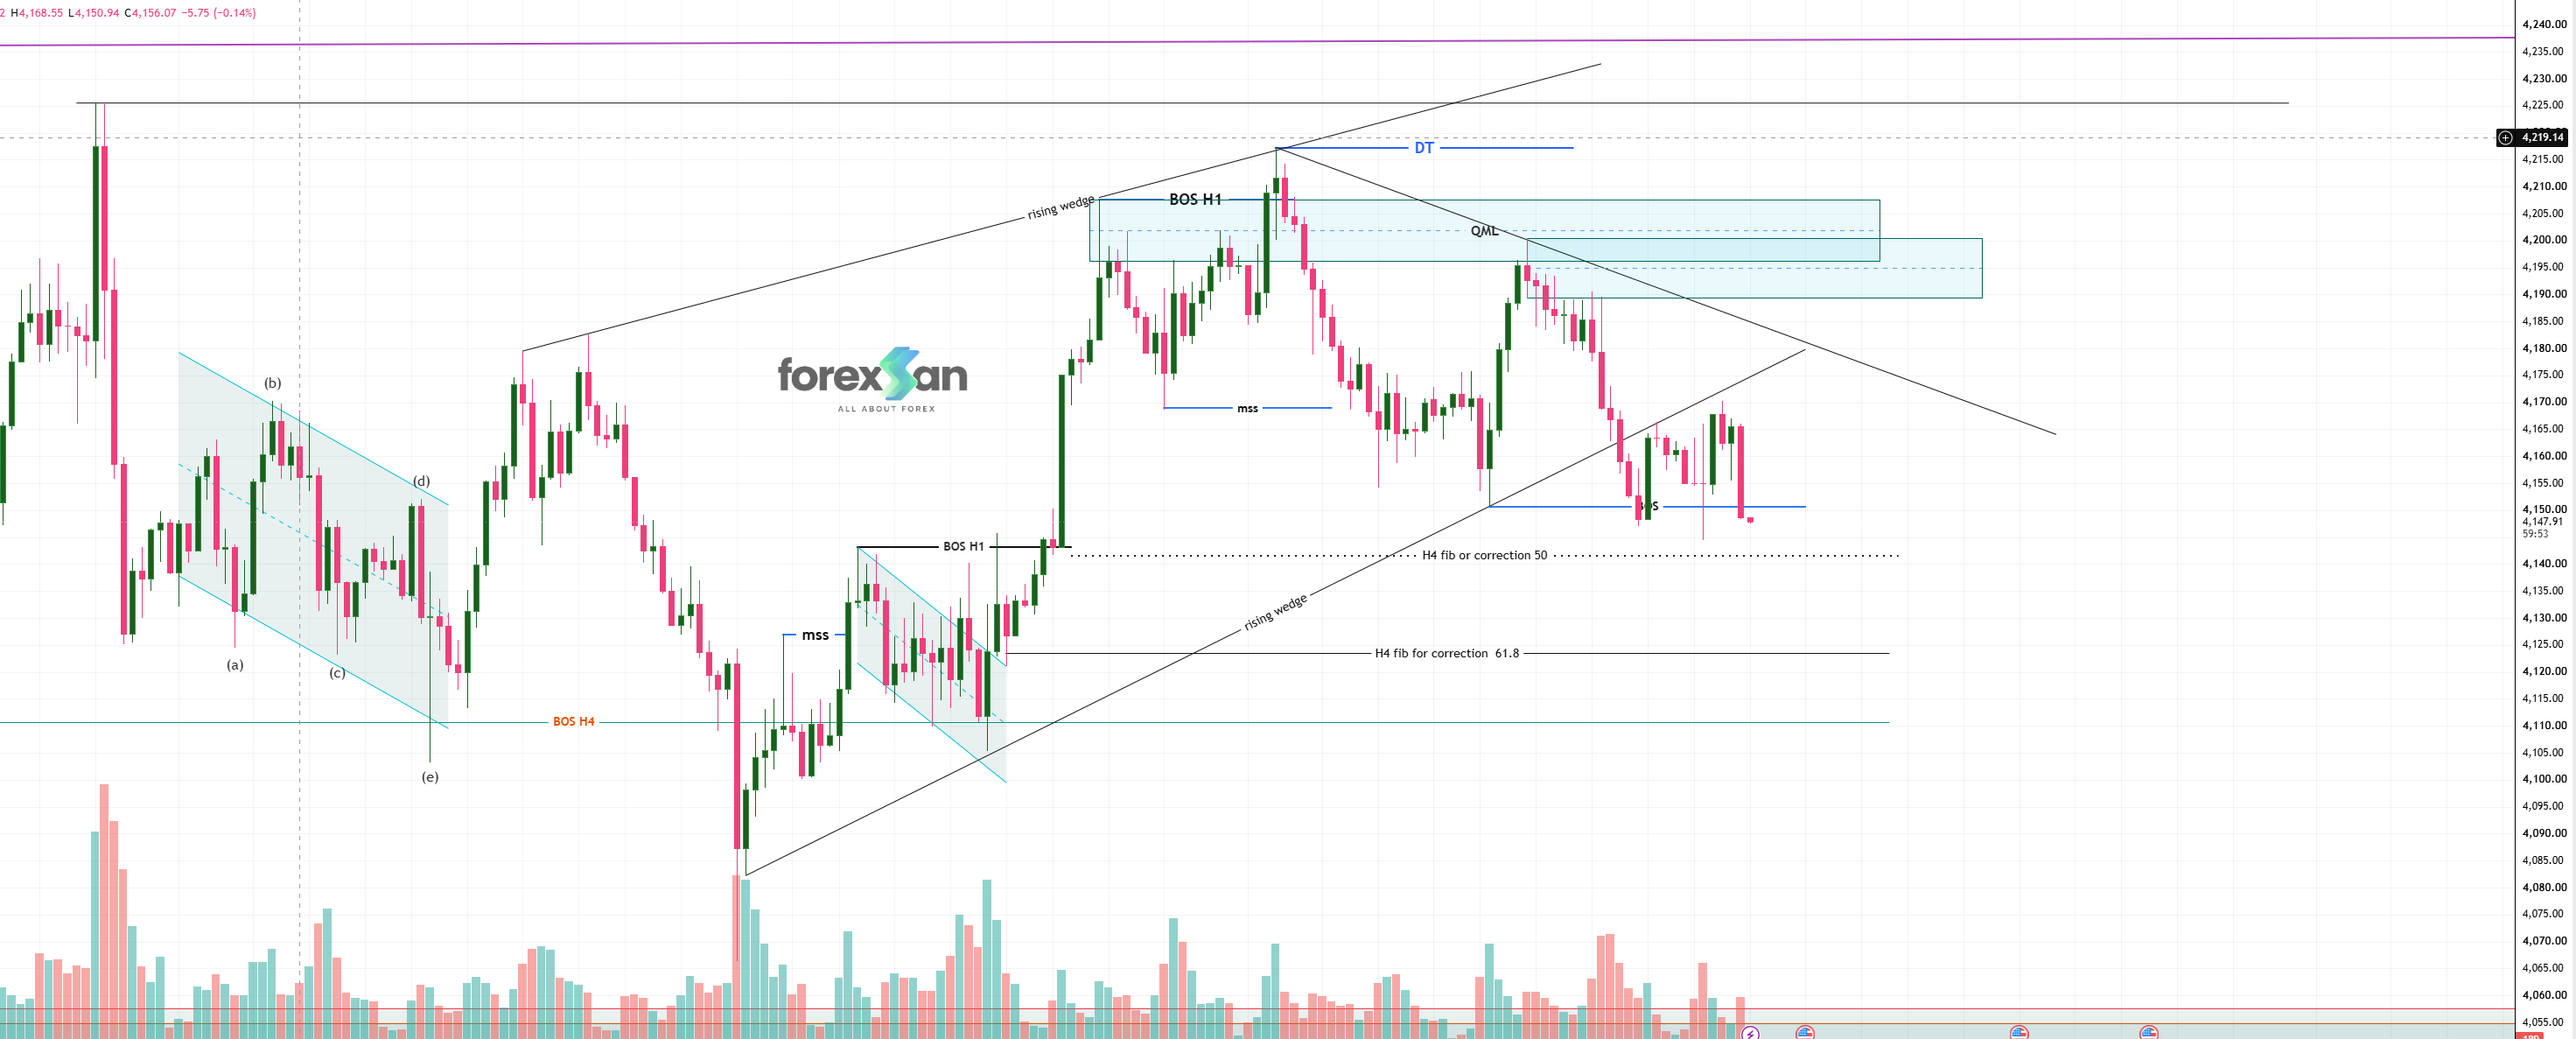
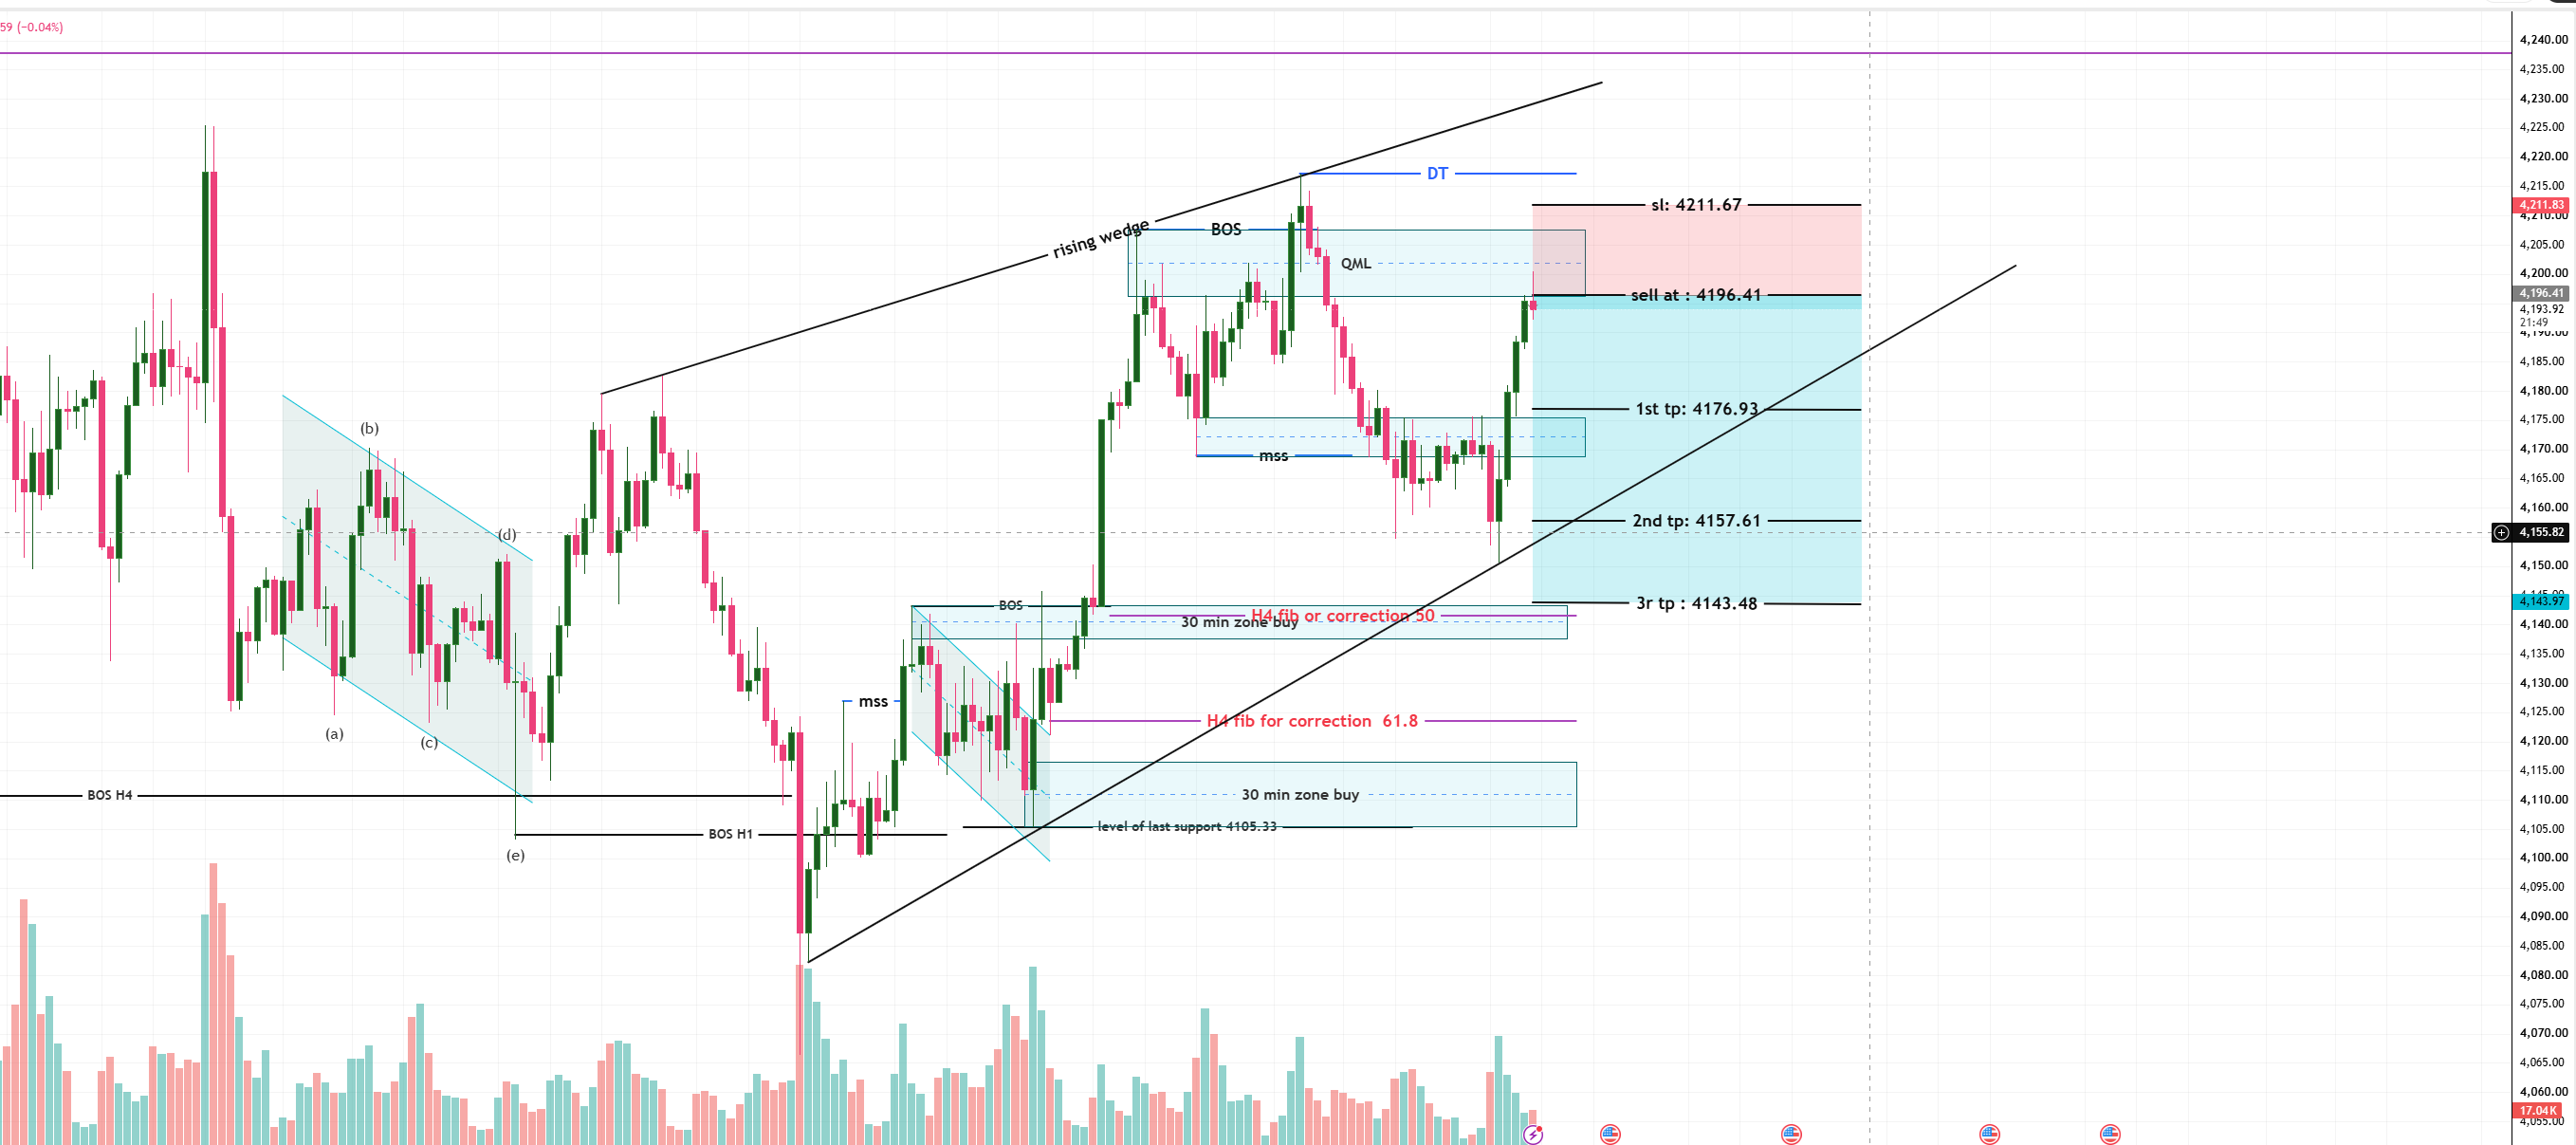
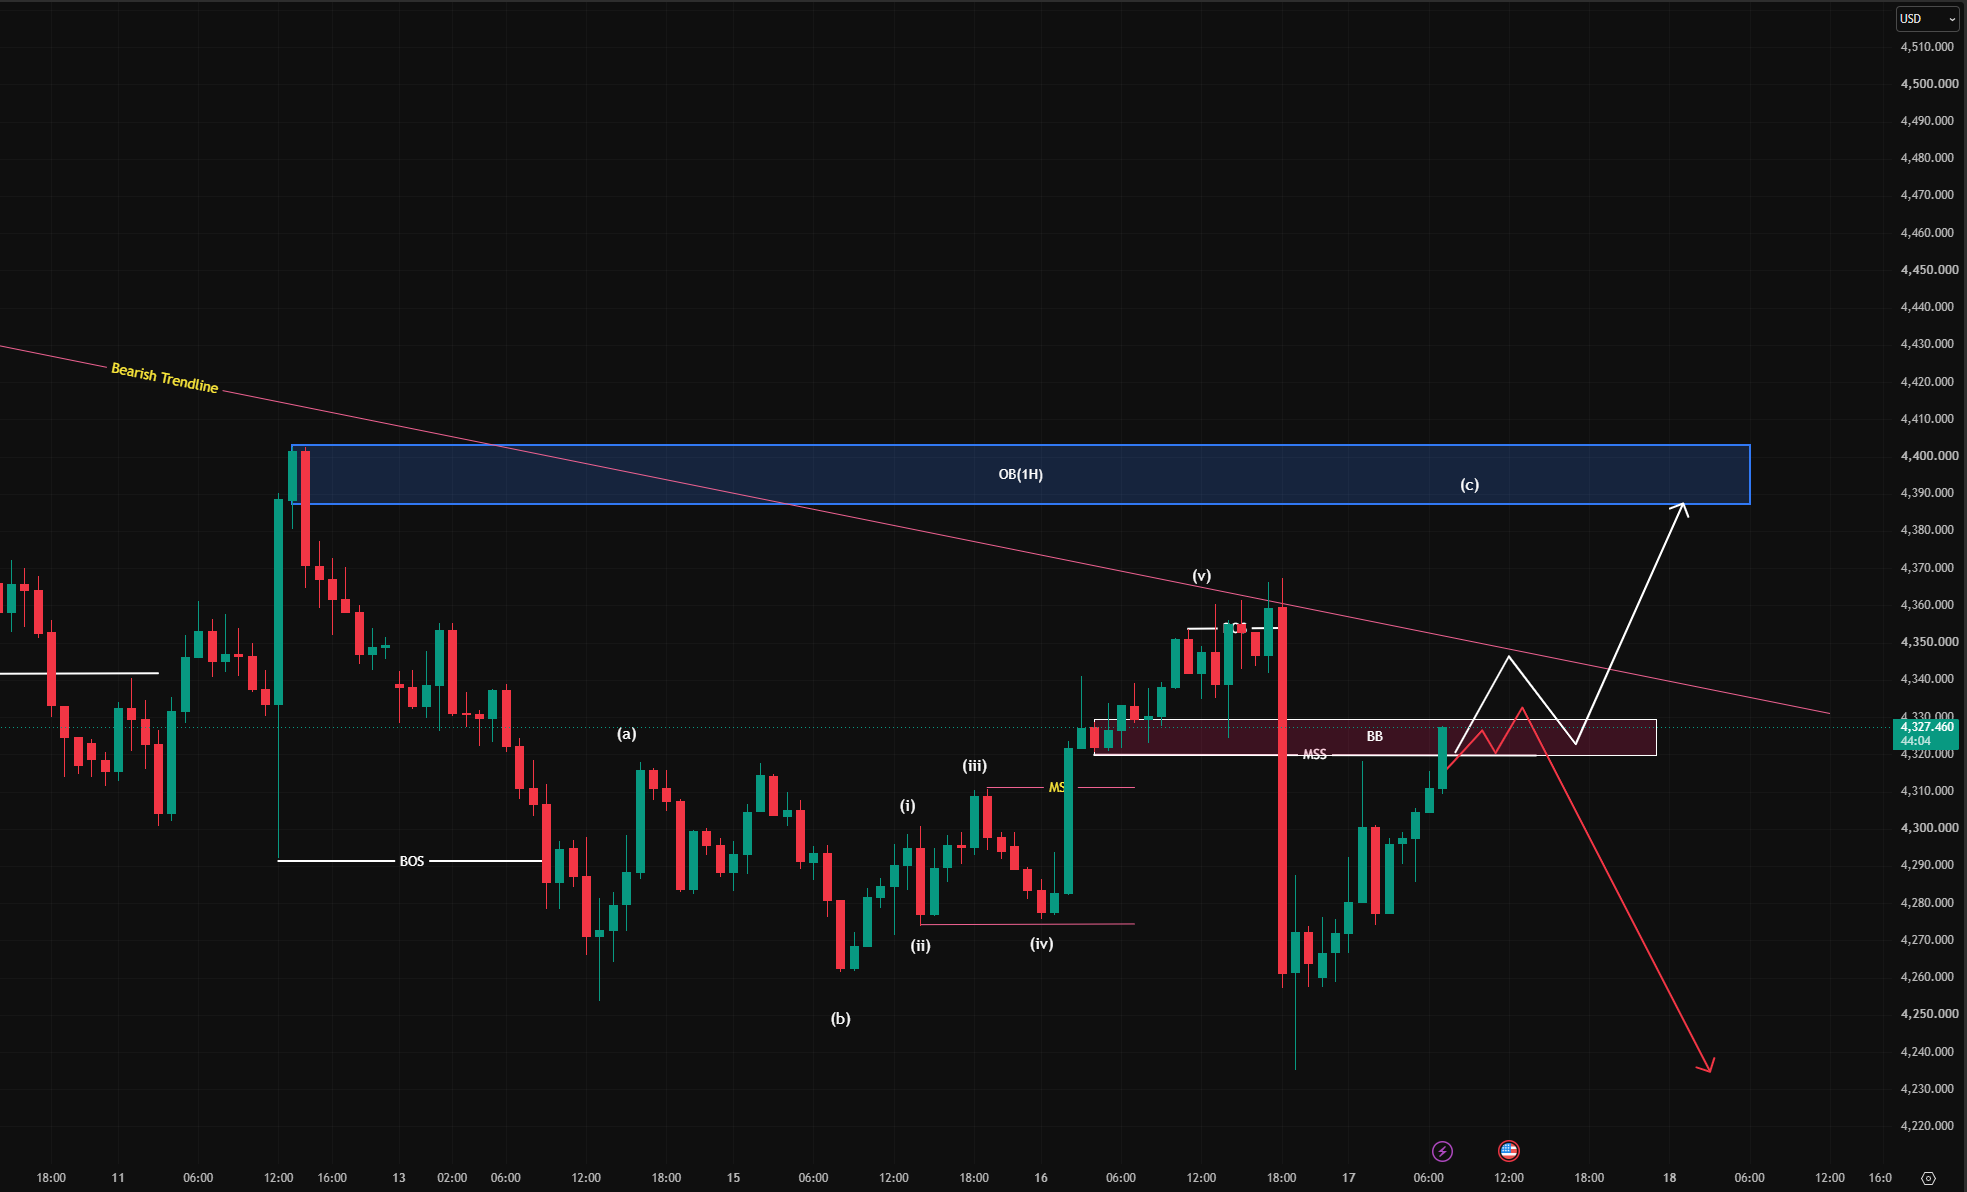
Gold (XAU/USD) is currently testing a significant structural inflection point on the 1-hour timeframe. Following an impulse sequence, price action is consolidating inside a crucial retest zone defined by a Breaker Block (BB) and an active Bearish Trendline.
Technical Breakdown
Elliott Wave Structure: An internal impulse wave (i)-(ii)-(iii)-(iv)-(v) completed its initial leg, establishing the foundation for a corrective (a)-(b)-(c) expansion toward higher supply zones.
Resistance Confluence: Major overhead supply rests at the 1H Order Block (OB) between 4,390–4,400, reinforced by a descending Bearish Trendline.
Support & Pivot Zone: The current structural pivot is located at 4,320–4,330, marked by a Breaker Block (BB) and a Market Structure Shift (MSS) line.
Trading Scenarios
1. Bullish Continuation Path
Trigger: Strong price acceptance and hold above the 4,320–4,330 Breaker Block.
Confirmation: A breakout and 1H candle close above the Bearish Trendline.
Target: 4,390–4,400 (1H Order Block) to complete Wave (c).
2. Bearish Rejection Path
Trigger: Sharp rejection from the trendline and failure to maintain momentum above 4,320.
Confirmation: Break below local session lows.
Target: 4,230–4,250 liquidity region.
Conclusion Traders should monitor the 4,320–4,330 region closely for confirmation patterns (e.g., bullish engulfing or lower-frame market structure shifts) before committing to a bias.
Disclaimer: This analysis is strictly for educational purposes and does not constitute financial advice.