 Mobarok Hossain
 April 25, 2024
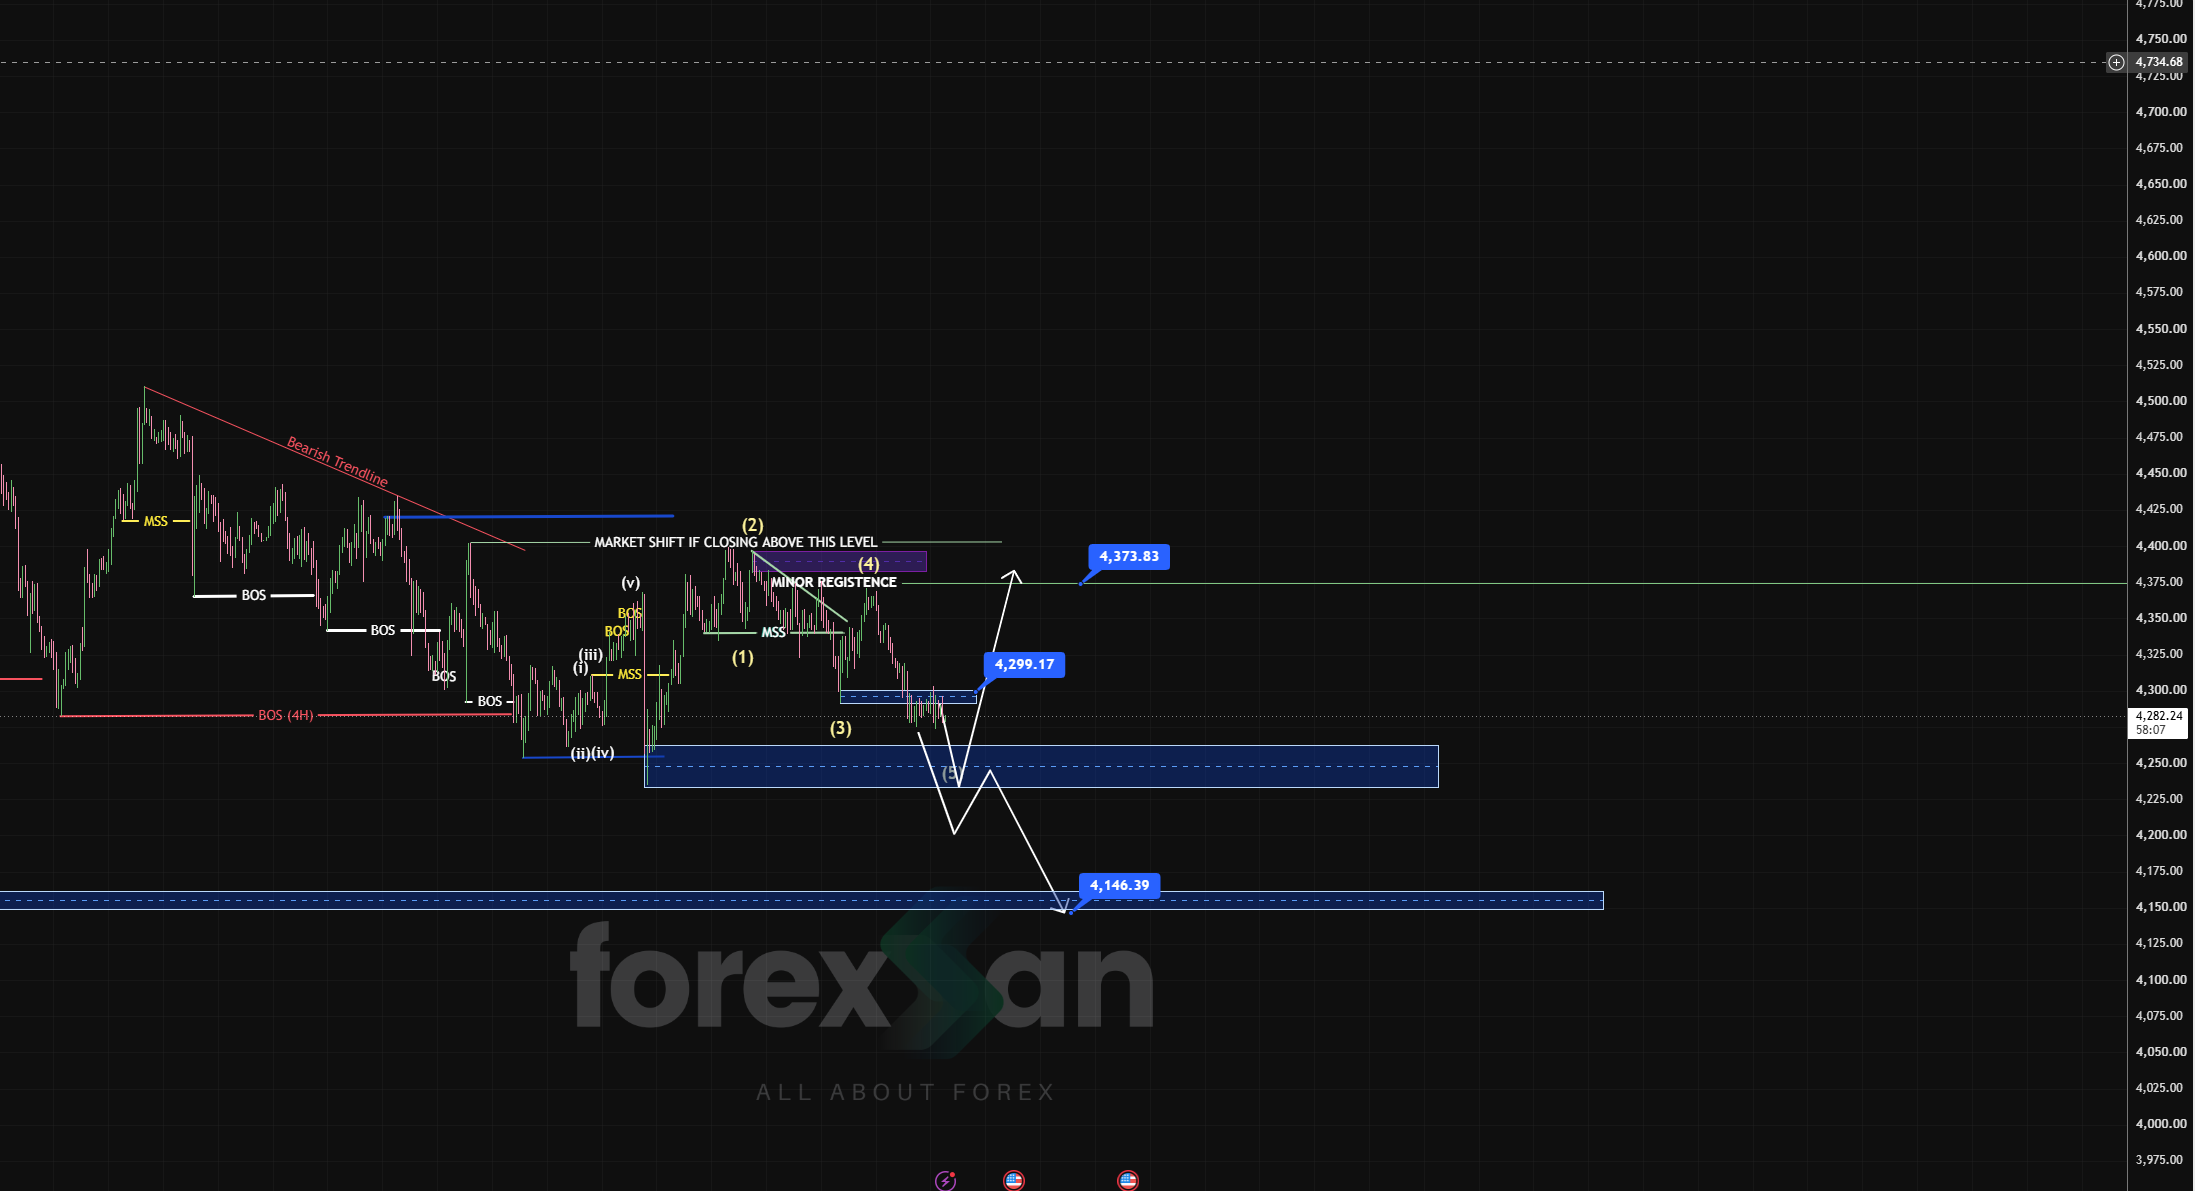
Gold (XAU/USD) continues its downward structure, moving into the completion phase of Wave (5). Price is currently testing the 4,240.00 – 4,260.00 demand zone, which serves as a crucial inflection point for either a relief rally or a deeper sell-off.
Technical Breakdown
Elliott Wave Development: Following the completion of Wave (3) and the Wave (4) minor resistance pullback, price action is expanding downward to finish Wave (5).
Primary Demand Support: The 4,240.00 – 4,260.00 zone represents major structural support where buyers may step in for a counter-trend move.
Overhead Resistance: The immediate flipped resistance sits at 4,299.17, followed by the primary supply level at 4,373.83.
Lower Structural Demand: Below 4,240, the next significant higher-timeframe support sits at 4,146.39.
Potential Trading Scenarios
1. Demand Zone Rebound (Bullish Path)
Trigger: Strong reaction and bullish Market Structure Shift (MSS) inside the 4,240.00 – 4,260.00 region.
Targets: 4,299.17 (Target 1) and 4,373.83 (Target 2).
2. Bearish Breakdown (Continuation Path)
Trigger: Acceptance and sustained 1H candle close below 4,240.00.
Target: 4,146.39 (Lower Liquidity / Demand Zone).
Conclusion Traders should closely watch price action as Gold enters the 4,240 – 4,260 area. Patience is required to confirm whether the demand zone holds for a relief move toward 4,299.17 or breaks down toward 4,146.39.
Disclaimer: This analysis is provided for educational and informational purposes only and does not constitute financial advice.