

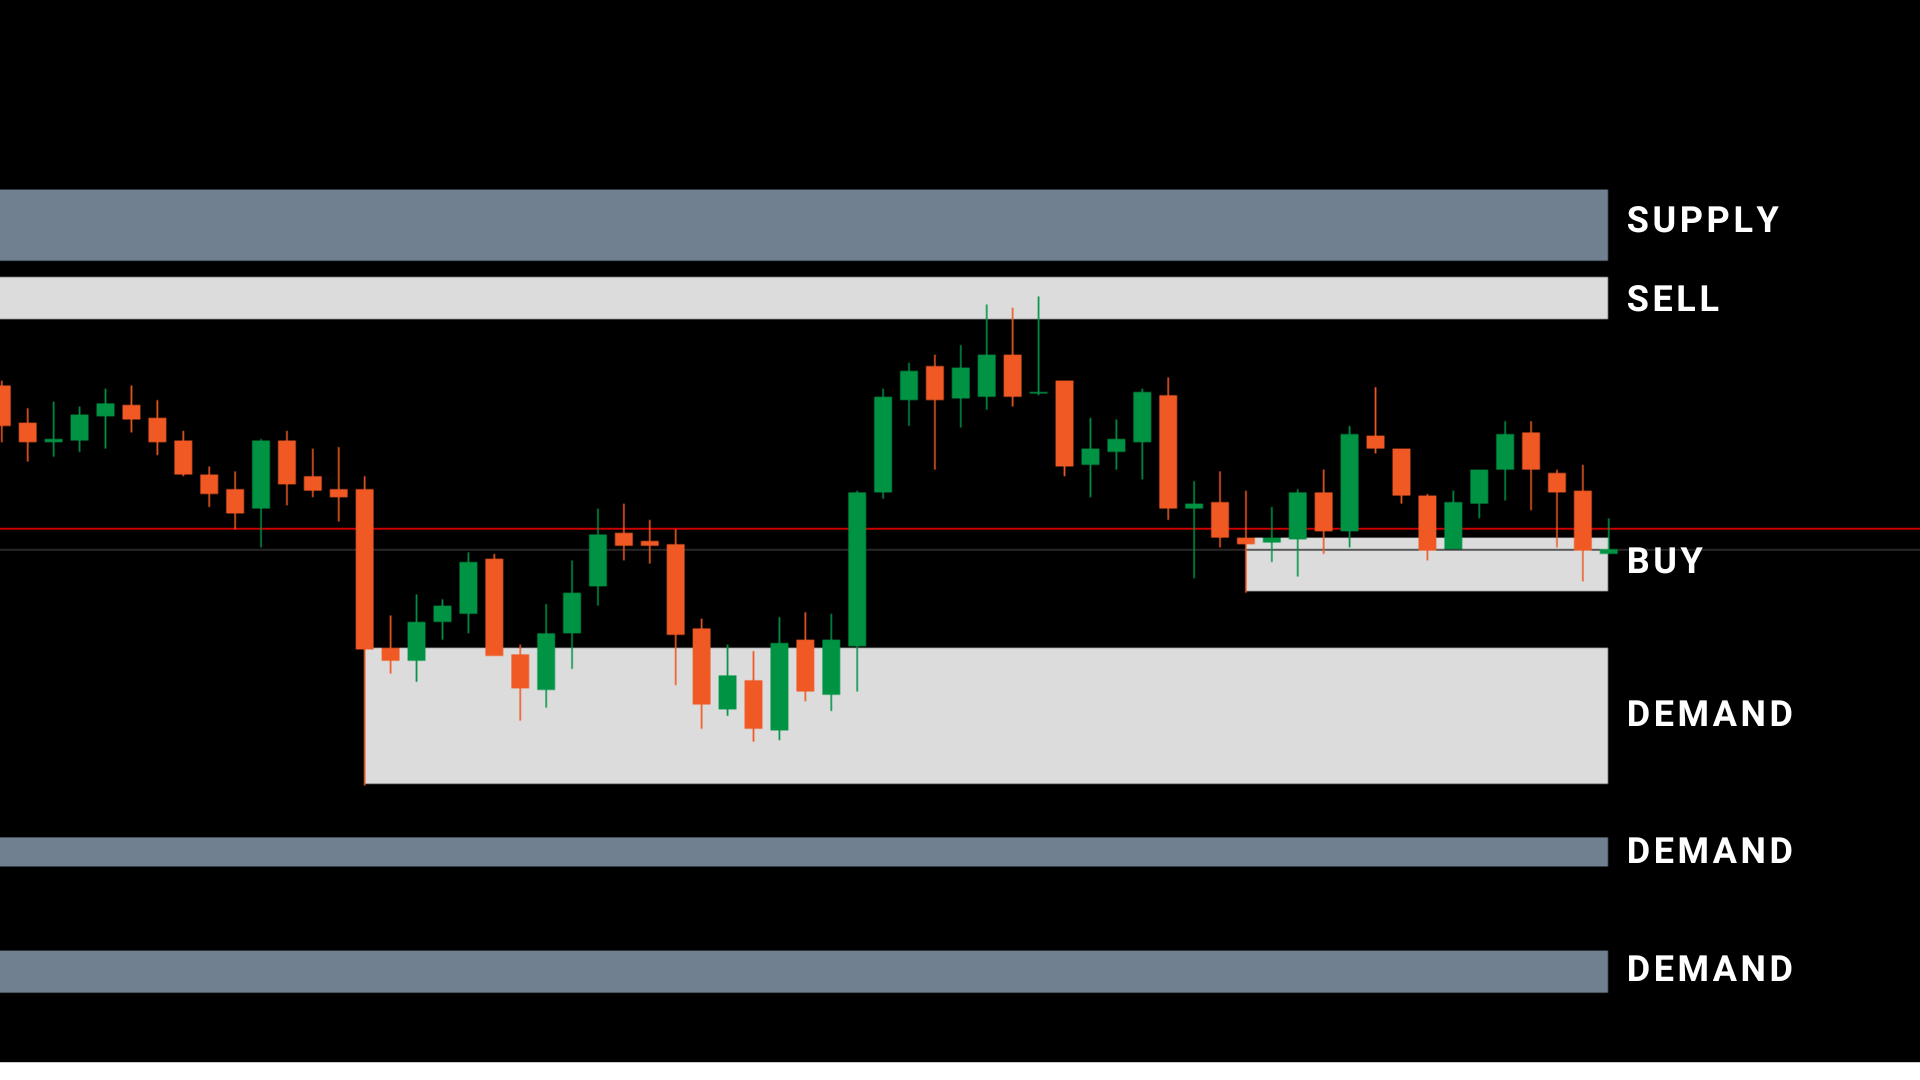
The Supply and Demand Zones Indicator in forex simplifies trading decisions by highlighting key zones on the chart. It categorizes zones as white (reliable, tested at least twice) and grey (potential areas to watch). Traders can sell at supply and buy at demand, making it a valuable tool for both beginners and experienced traders seeking accurate market insights.
The Supply and Demand Zones Indicator is a powerful tool for forex traders, especially those who are new to the market. It helps identify key zones where the market is likely to react strongly.
Using the Supply and Demand Zones Indicator is straightforward. Think of these zones as support and resistance levels. When the price hits the supply zone, it tends to move downwards, and when it hits the demand zone, it tends to move upwards. This simple rule can guide your trading decisions.
This indicator is beneficial for all forex traders, especially beginners who may struggle with recognizing support and resistance levels. Even experienced traders can appreciate its accuracy. While some traders may have their own zone-drawing methods, the reliability of this indicator makes it a useful tool for anyone using supply and demand in their trading strategy.
Conclusion: The Supply and Demand Zones Indicator simplifies trading decisions by highlighting key zones on the chart. Whether you're a beginner or an experienced trader, incorporating this tool into your strategy can enhance your overall trading experience.