 Mobarok Hossain
 April 25, 2024
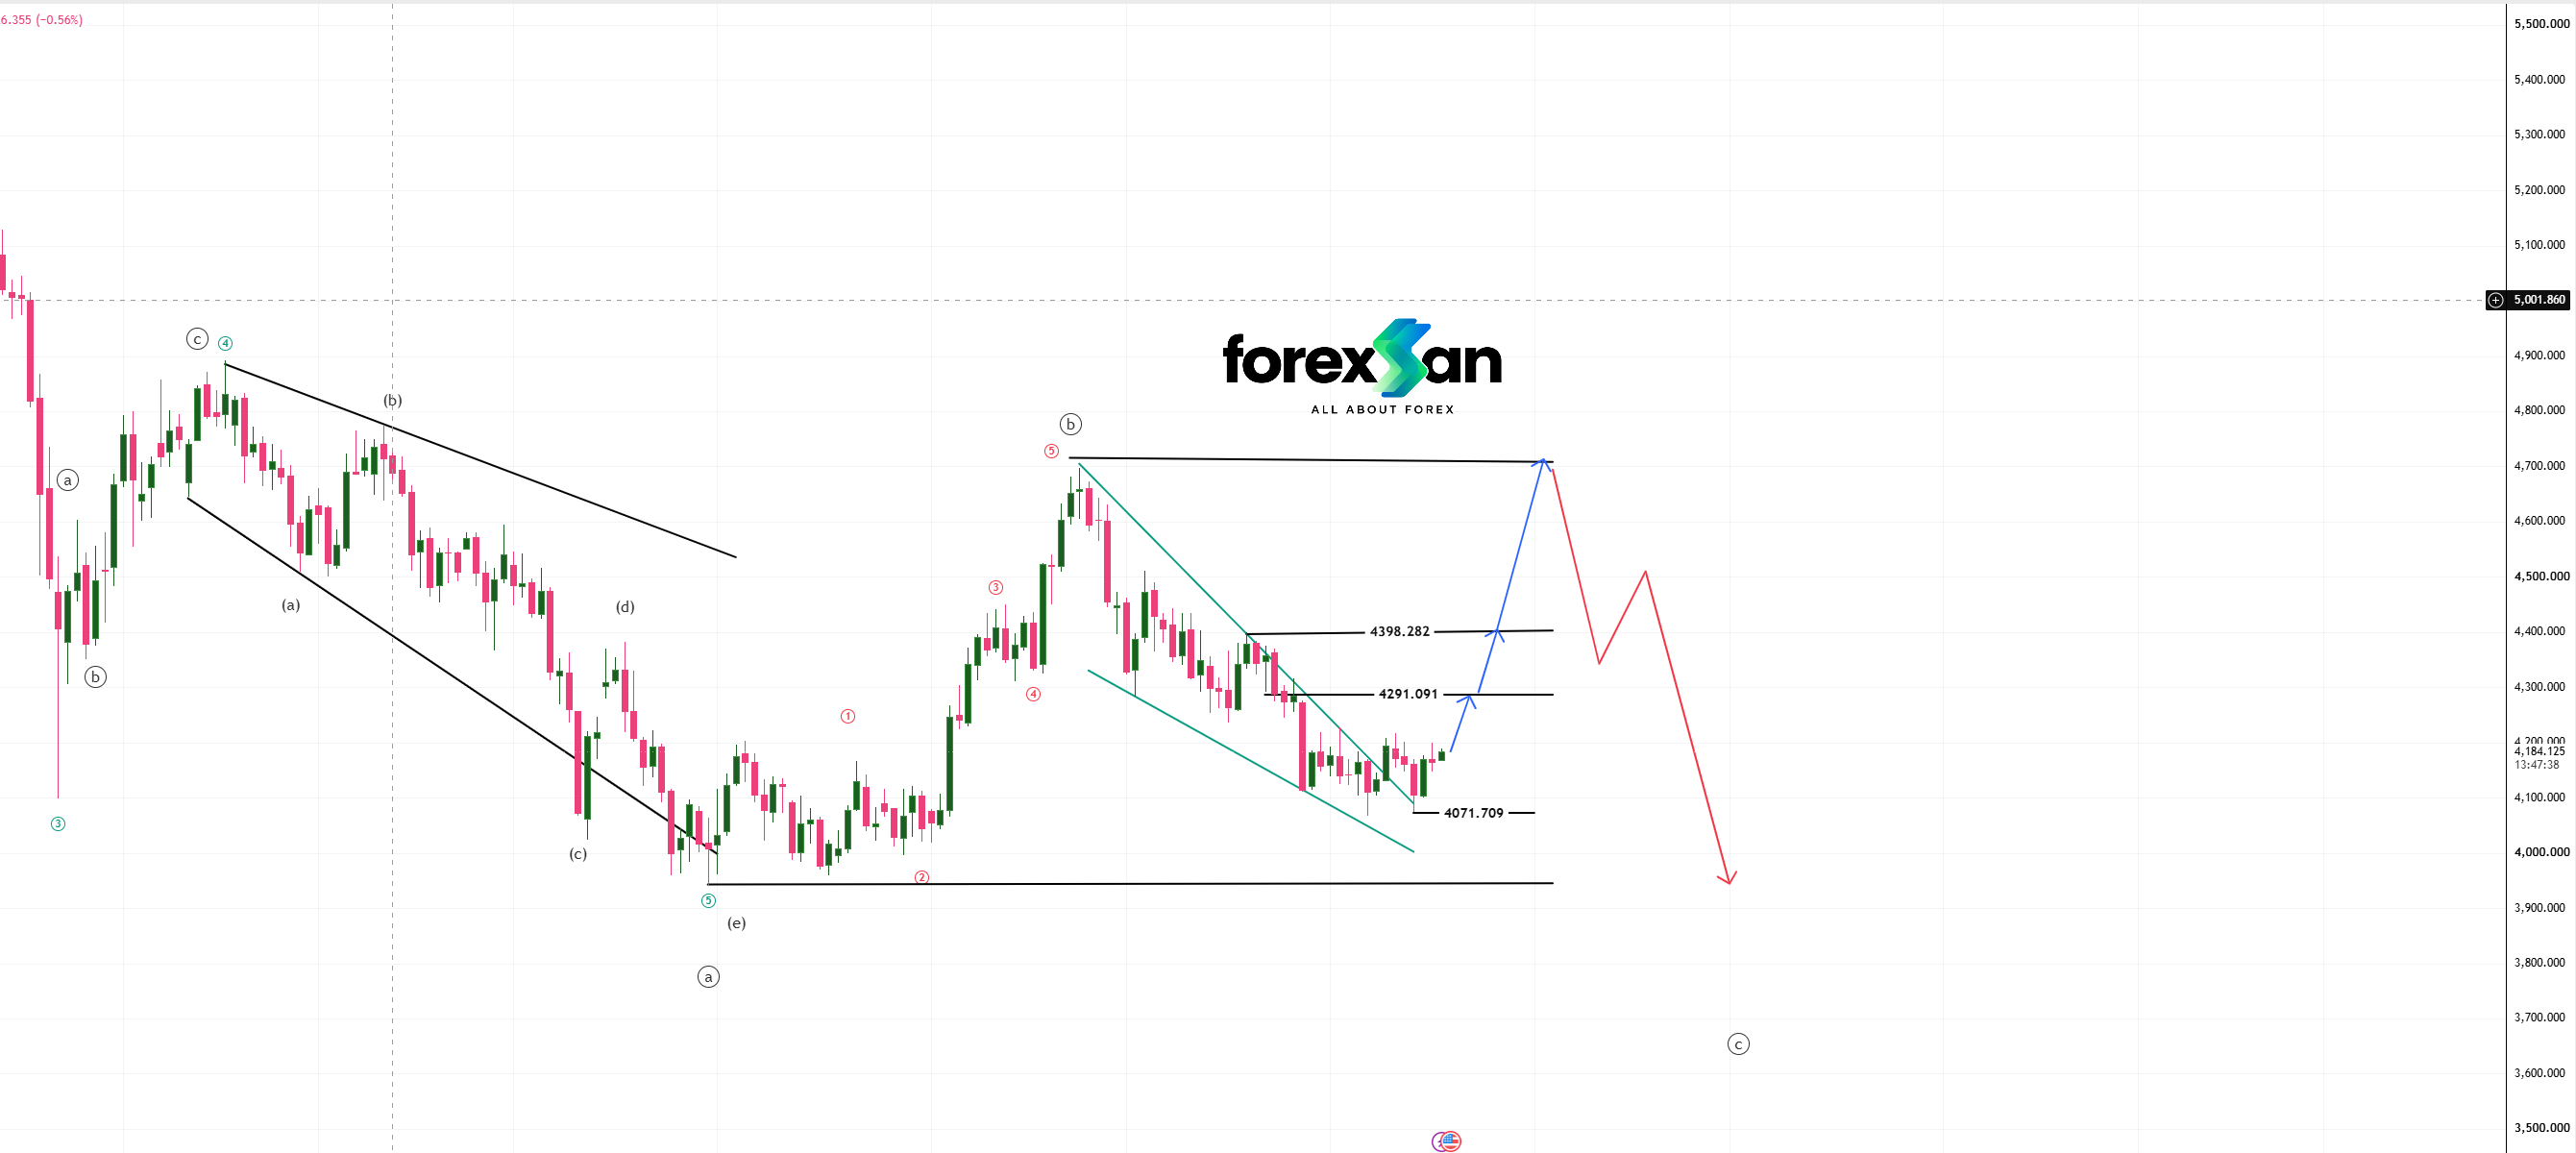
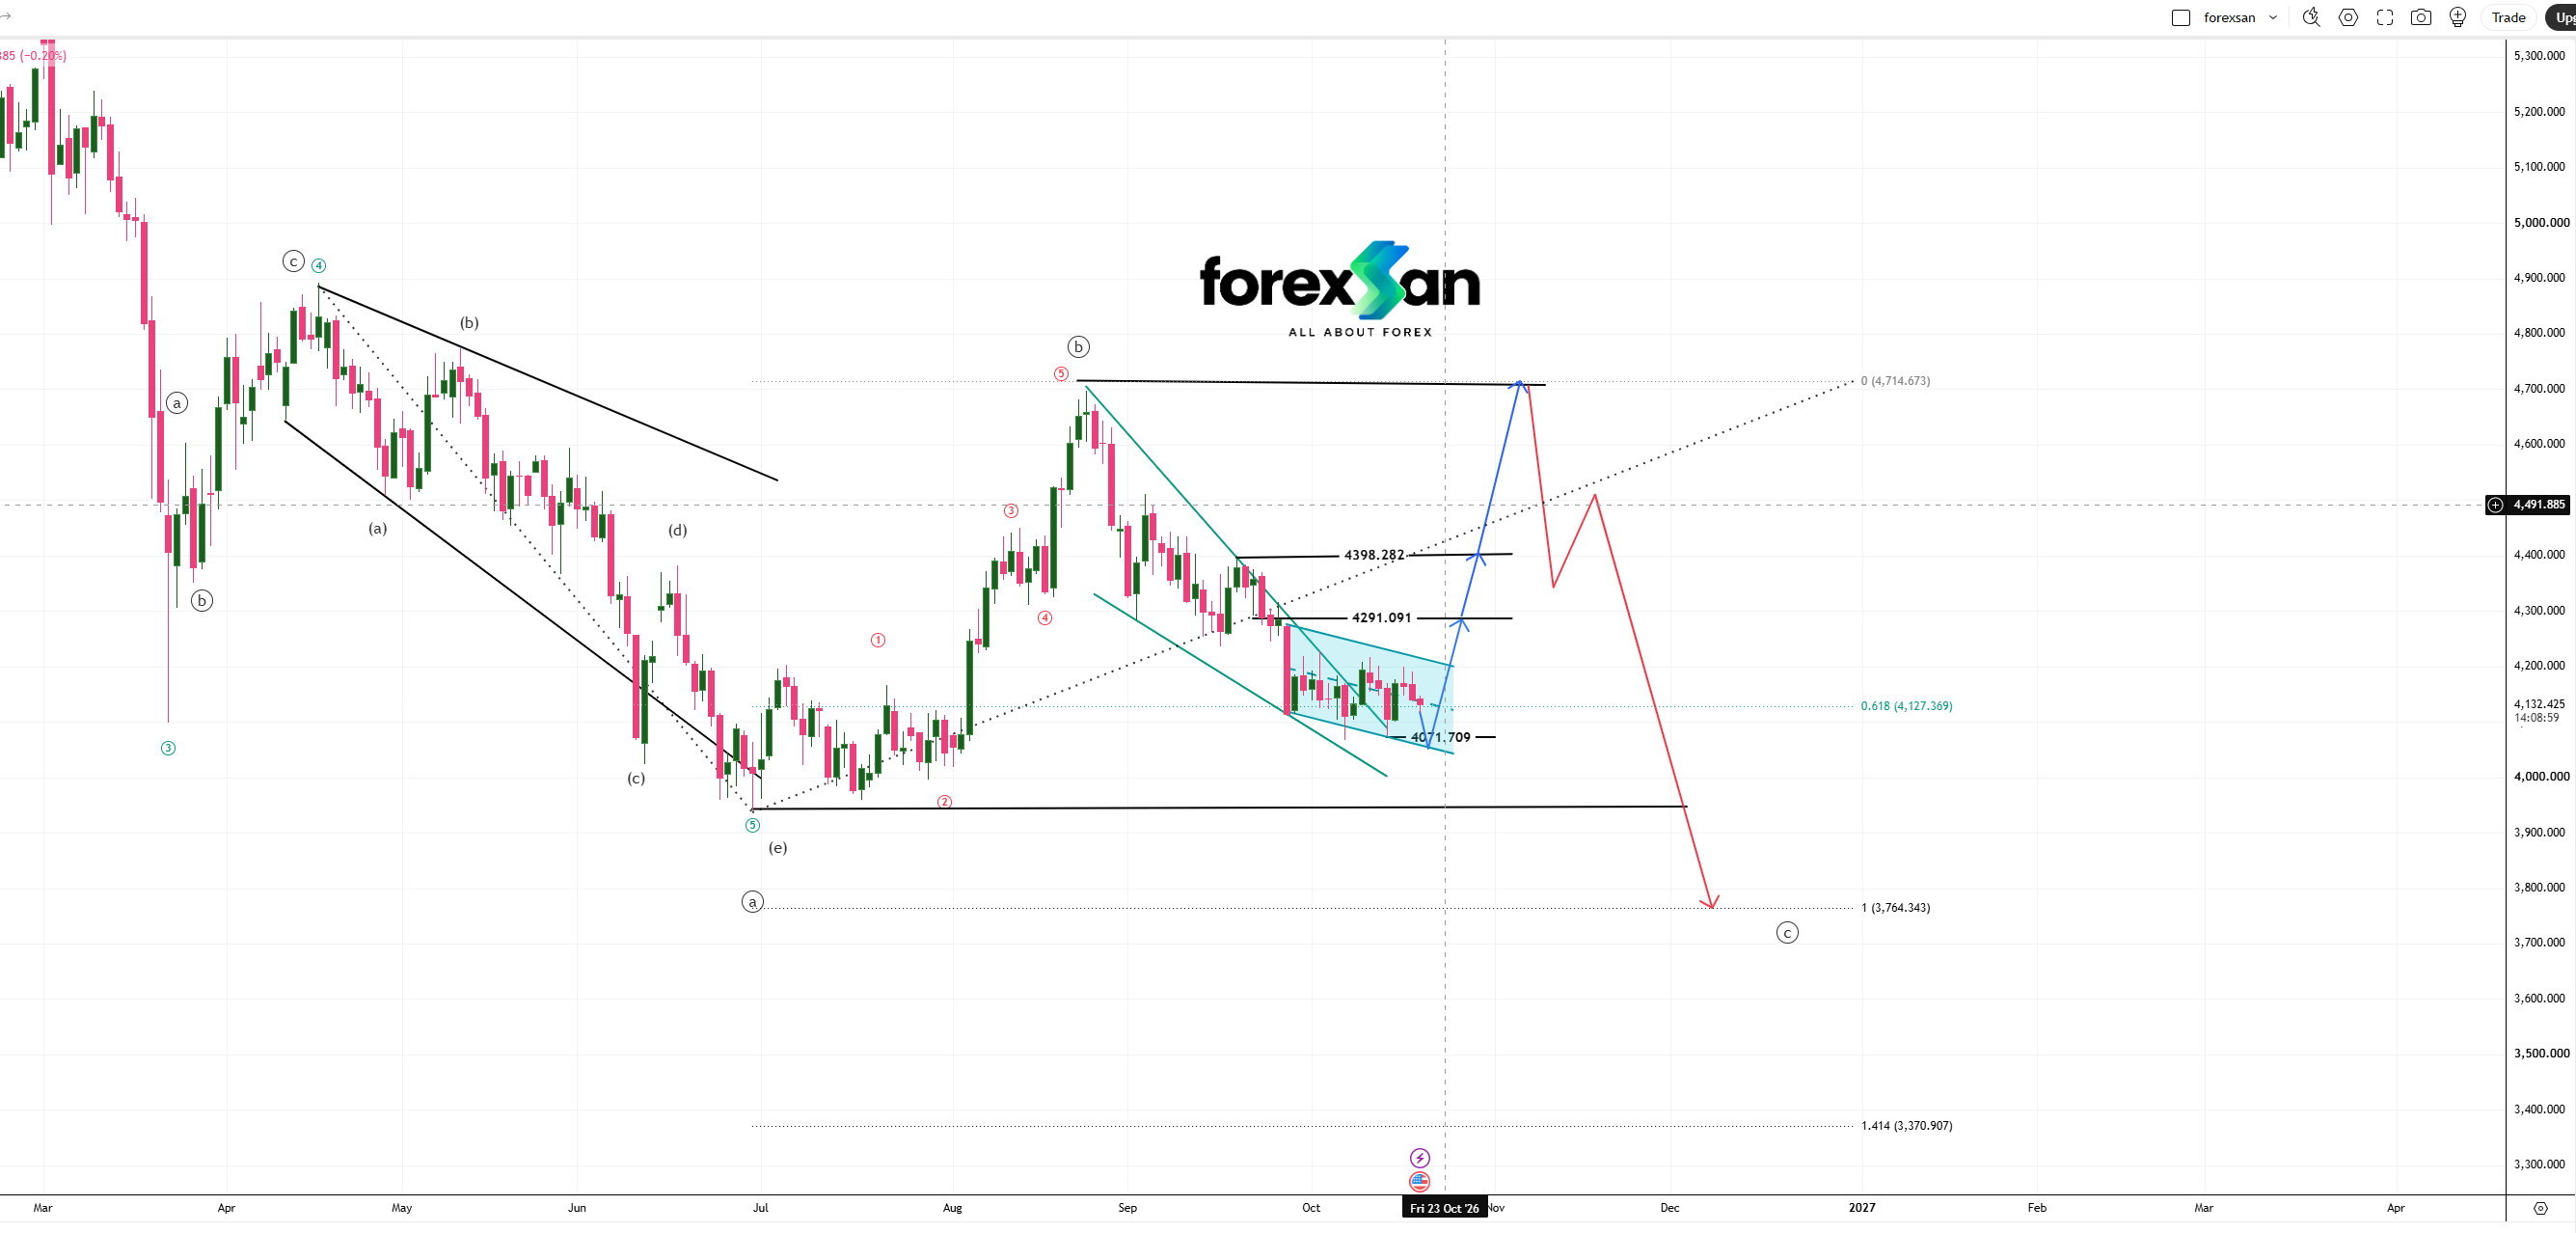
Spot Gold (XAU/USD) has completed its local corrective leg, finding strong buyer demand above the **0.618 Fibonacci level (4,127.369)** and structural support at **4,071.709**. Price action is breaking out of a bullish **Falling Wedge** pattern, pointing toward a multi-stage Elliott Wave (b) corrective rally before the overarching macro Wave (c) structure unfolds.
### **Key Technical & Fibonacci Levels**
* **Structural Support Floor:** **4,071.709** (Confluence with 0.618 Fib at **4,127.369**)
* **Immediate Resistance Target (T1):** **4,291.091**
* **Secondary Resistance Target (T2):** **4,398.282**
* **Major Wave (b) Completion Target:** **4,714.673** (0.0 Fibonacci Level)
* **Macro Wave (c) Downside Projections:** **3,764.343** (1.0 Fib Extension) & **3,370.907** (1.414 Fib Extension)
---
### **Market Outlook & Strategy**
1. **Wedge Breakout Execution:** The hold above **4,071.70** validates the falling wedge pattern, signaling seller exhaustion and a shift in order flow back to the buyers.
2. **Upside Wave Targets:** The immediate price structure favors expansion through **4,291.09** and **4,398.28**, with ultimate upside objectives testing the **4,714.67** resistance area.
3. **Macro Context:** Traders should recognize that this upward move represents a corrective Wave (b). Upon completion around the **4,714.67** level, institutional selling interest is projected to drive a macro Wave (c) expansion down toward **3,764.34** and **3,370.90**.
---
*Disclaimer: This analysis is provided strictly for educational purposes and does not constitute financial or investment advice.*